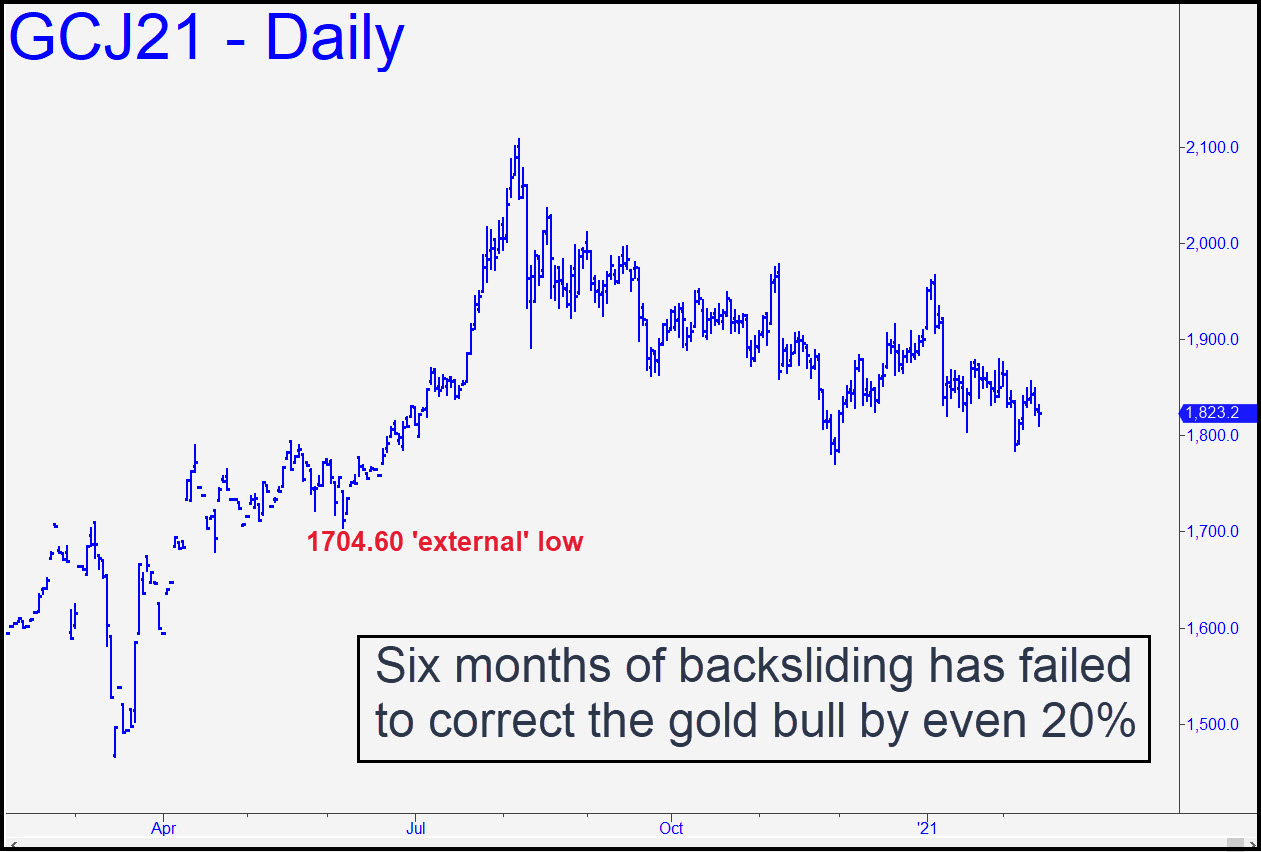
 Gold remains easily tradeable not only on the intraday charts, but on the ‘daily’ as well. A routine ‘mechanical’ short sketched out here last week produced a quick profit of $3100 per contract, even if the set-up was uninspiring. Traders should have no illusions, however, that they will be catching the start of a major move. since the long, tedious slog lower since last August offers no hint of a significant turn. The correction at the December low amounted to just 16% off the 2107 high recorded in August, not even qualifying as a bear market. Nor has the correction produced a bearish impulse leg on the daily chart; that would take a breach of the 1704 low recorded last June. Wake me if this happens, or if a powerful stab higher takes out November’s 1978 high — an event that would be bullishly impulsive and suggest gold might be on its way to as high as 2284. _______ UPDATE (Feb 16, 10:03 a.m. EST): The futures are getting pounded today for no good reason, presumably bound for the 1765.50 target shown. They typically do not reach D targets in either direction, but in this case the precipitous move through p suggests selling will go the distance. Here’s the chart. _____ UPDATE (Feb 17, 8:37 p.m.): A so far feeble bounce has occurred from within 2.40 points of the 1765.50 target, but it would take a print at 1795.20 to lift bulls from immediate jeopardy. _______ UPDATE (Feb 18, 9:43 p.m.): Gold got barely any bounce from the 1765.50 target. This means it is about to fall to 1749.80, where you should look for a tradeable bounce. Here’s the chart.
GCJ21 – April Gold (Last:1766.20)
 Posted on February 14, 2021, 5:15 pm EST
Last Updated February 18, 2021, 9:43 pm EST
