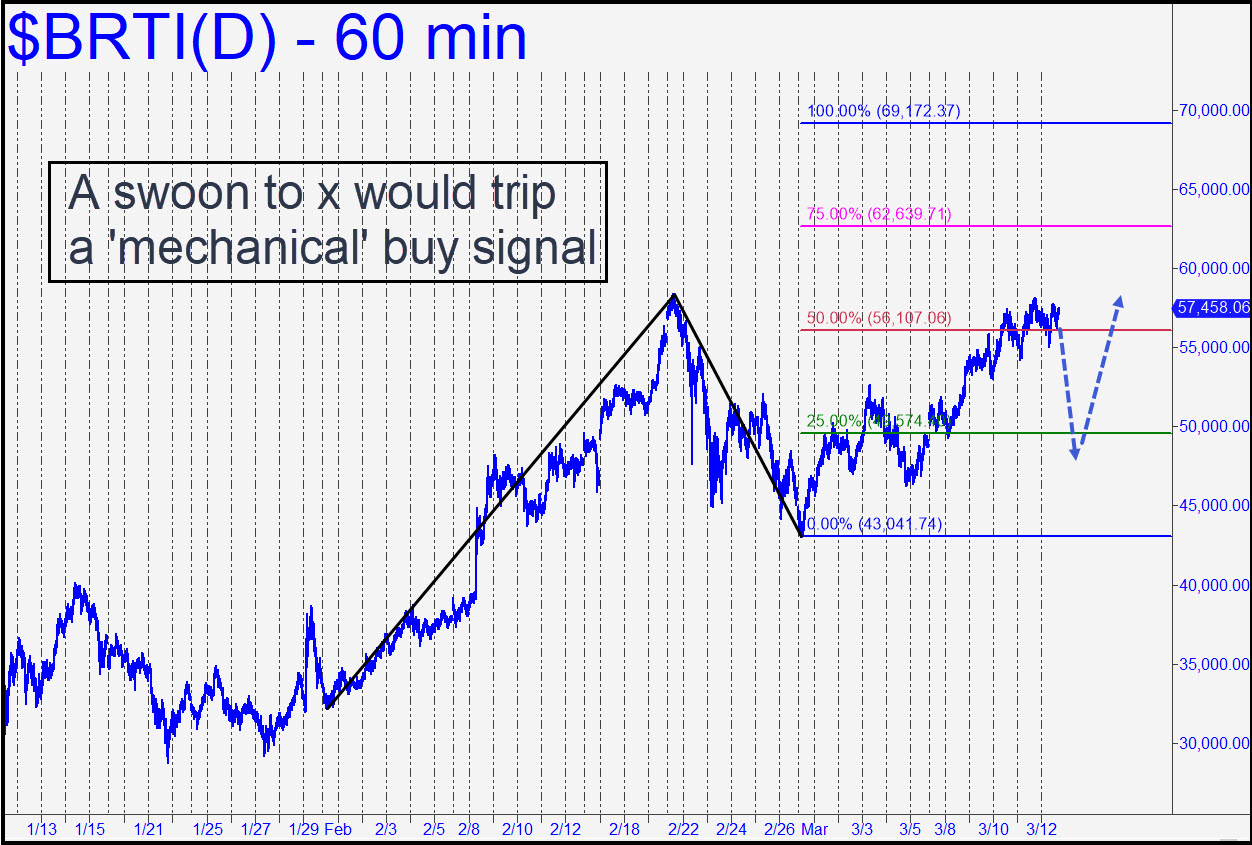
 We’ve been using a 66,880 rally target that comes from the weekly chart and which tripped a ‘mechanical’ buy signal down at 47,845 (stop 41,500). However, the lesser pattern shown in this chart has a higher target at 69,172 that will give us more running room and a chance to get aboard belatedly, since the current long, with enormous entry risk, was originally proffered as a paper trade. The nearly $7,000 swoon to the green line required to trigger the trade seems unlikely, given the steep, uncorrected pitch of the rally, but we may be able to craft a ‘reverse ABC’ set-up or a ‘mechanical’ bid at the red line to get us aboard. Stay tuned to the chat room if you’re interested, and make sure the ’email notifications’ feature on your account dashboard is turned on. _______ UPDATE (Mar 23, 6:41 p.m.): A fall to the green line would trigger a ‘mechanical’ buy, but because we’re long already on paper, and because the opportunity has evolved into something less than stellar, I’ll issue no new buy recommendation. The paper long from 47,845 remains tied to a 41,700 stop-loss, with half covered on 2/21 at p2=57,363 (daily chart, A= 7580 on 3/11/20). Its imputed cost basis is 38,327.

