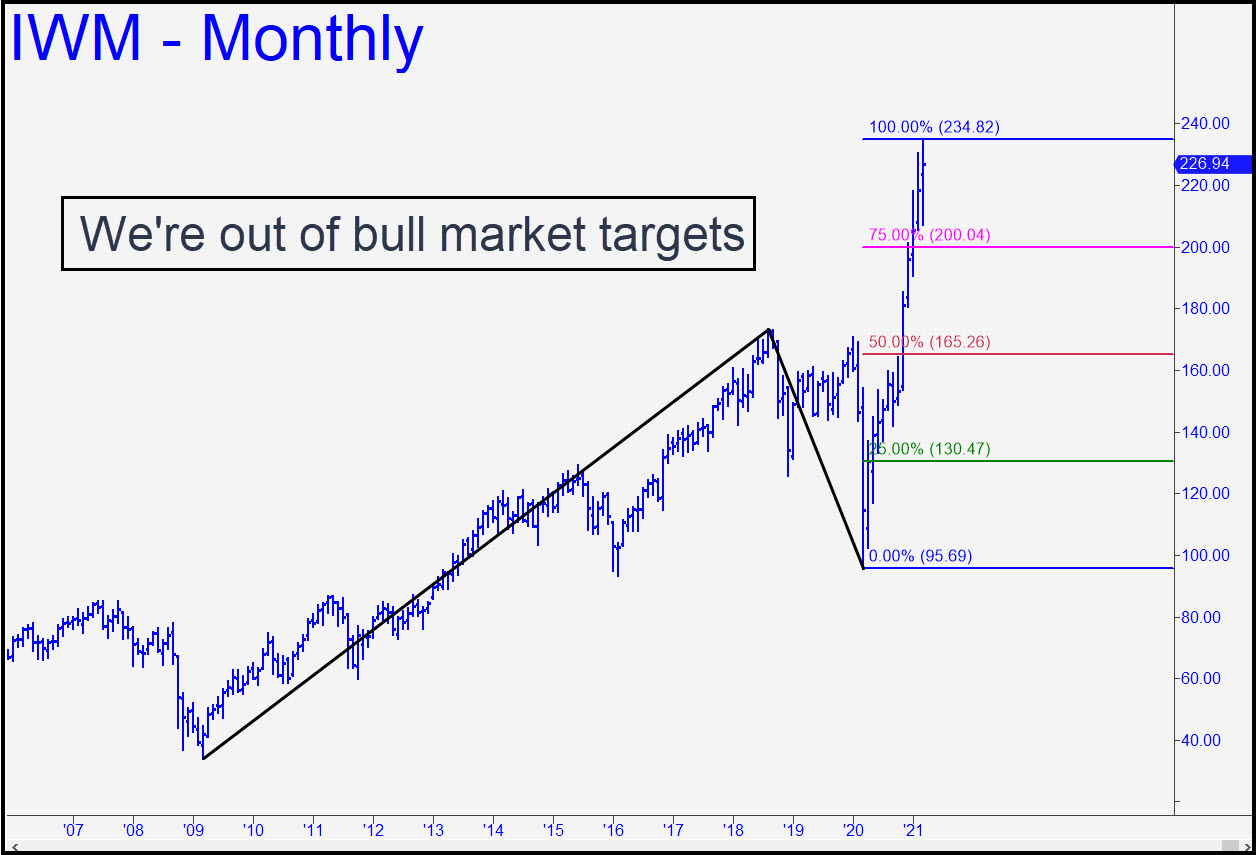
 The chart, with a 234.82 target that was missed by a fraction of a millimeter, is starting to look familiar, but it shows the last clear bull-market target that can be extrapolated from monthly bars. Moreover, the ABC coordinates of the bull-market pattern are anchored in bedrock, tied respectively to the bear market low in 2009, then the high and low of the pandemic crash. I advised getting short via call options in TZA, an inverse 3x bear ETF, and the 15% rally that has occurred since, from 29.54 to 34.09, could have been used to take a healthy partial profit. Set a 30.08 stop-loss for what remains, but you can raise it to break-even levels if you have yet to exit any shares or calls. _______ UPDATE (Mar 24, 11:20 p.m. EDT): The possibility that a major top is in remains a decent bet, given that the plunge from within a hair of the 234.82 target I’d drum-rolled earlier is now at nearly 10%. If a reversal is coming, it is likely to come from around 206, a number based on a gut feeling I have rather than on an ABCD pattern.
IWM – Russell 2000 ETF (Last:226.94)
 Posted on March 21, 2021, 5:17 pm EDT
Last Updated March 24, 2021, 11:21 pm EDT
