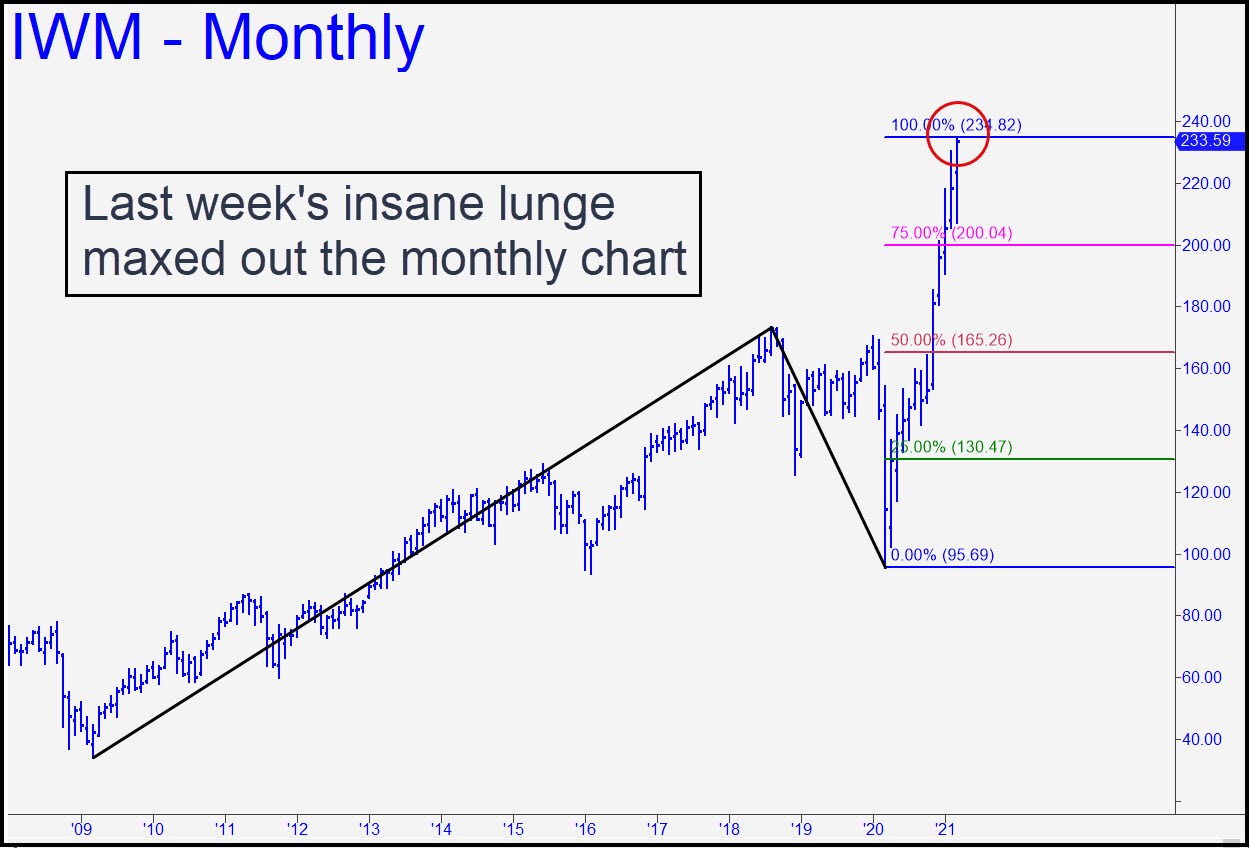
 Last week’s steep vertical climb came within 0.67, or less than two-tenths of a percentage point, of a longstanding target at 234.82, maxing out the monthly chart. I’d suggested getting short in TZA to leverage a possible top, but it never made it down to the 28.86-28.91 level where subscribers were instructed to place a bid. The order will remain viable on Monday, but because odds are heavily against it, you should maintain a tight stop-loss initially at 28.69. Here’s a TZA chart with a downtrending ABC pattern that corresponds inversely to IWM’s bullish move. _______ UPDATE (Mar 16, 6:15 p.m.): Playing cat-and-mouse with TZA wore me out, but some subscribers reported getting aboard near Monday’s low based on my downside target at 28.86. If so, take a small partial-profit so you can hold what remains without risking a loss. I cannot say with confidence whether TZA is at a major bottom, but IWM’s so-far infinitesimally small undershoot of a corresponding rally target, a very major one at 234.82, suggests it’s at least possible. ______ UPDATE (Mar 18, 5:38 p.m.): Finally, a day that bears could enjoy! The reversal in the early afternoon from a slight gain could spell trouble for the herd if it picks up speed and power ahead of the weekend.
IWM – Russell 2000 ETF (Last:225.85)
 Posted on March 14, 2021, 5:16 pm EDT
Last Updated March 18, 2021, 5:39 pm EDT
