
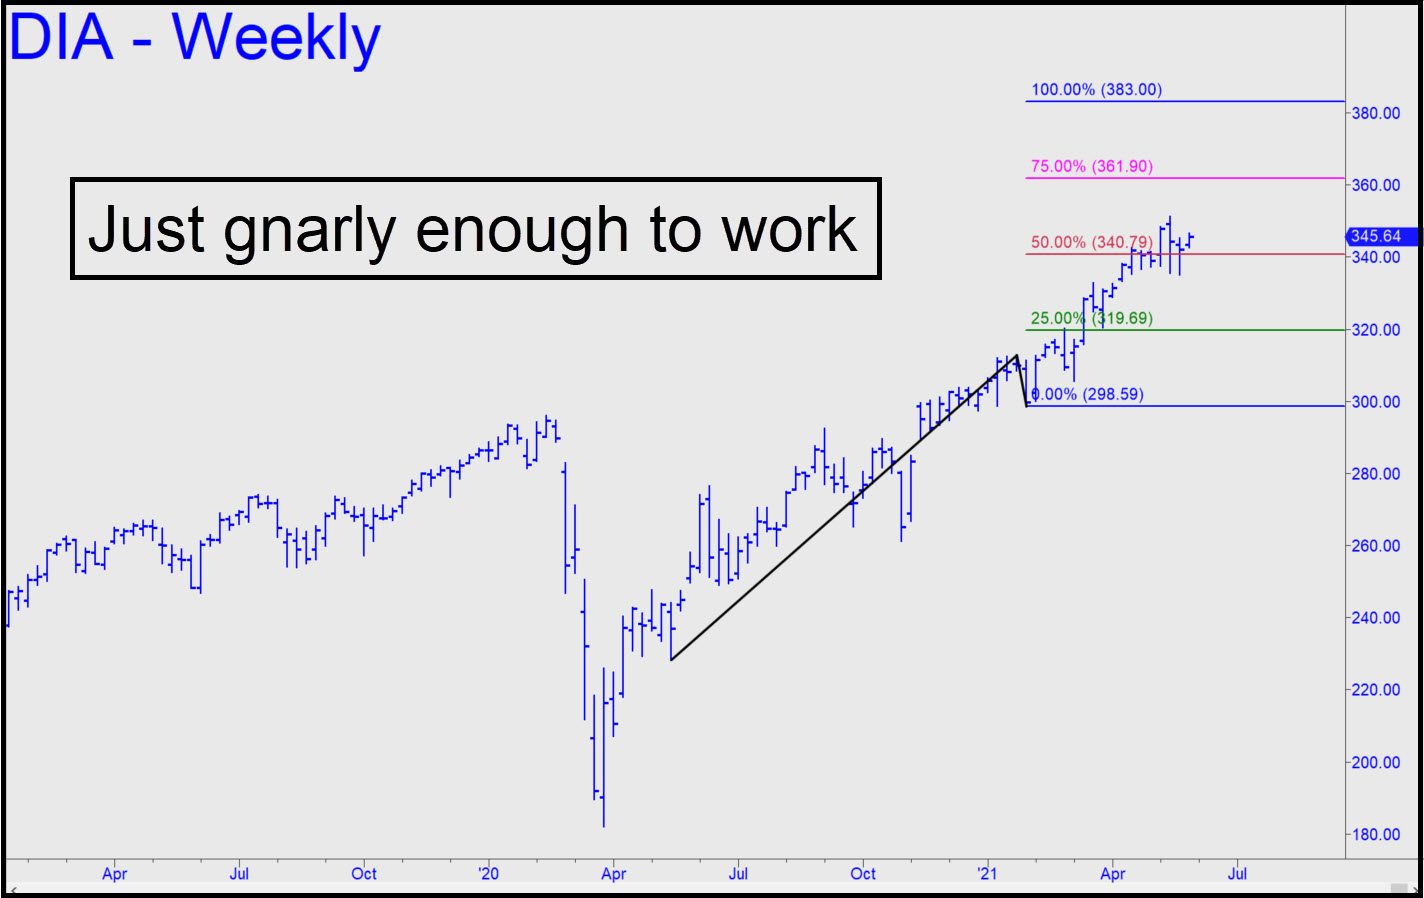
 The pattern shown, with a 383.00 target that lies 11% above, is just gnarly enough to work. It is similar to one featured in the Hidden Pivot Method Course, and it has the particular advantage of being invisible to most other chartists and traders. Price action at p is not exactly reassuring on whether D will be reached, but p2=361.90 looks like a good bet as a minimum upside projection for the next 4-6 weeks. A swoon to the green line (319.69) would most surely raise the kind of fears that ‘mechanical’ bids thrive on, but for now we’ll concentrate on trades of smaller degree in order to trade with the trend. That would imply rabc patterns on the hourly chart, going back no more than two weeks. _______ UPDATE (Jun 3, 10:06 p.m.): Bid 0.20 for four Jun 30 320/325/330 put butterfly spreads, day order. The order may be tough to fill at that price, so stay tuned for a possible intraday adjustment.
DIA – Dow Industrials ETF (Last:346.02)