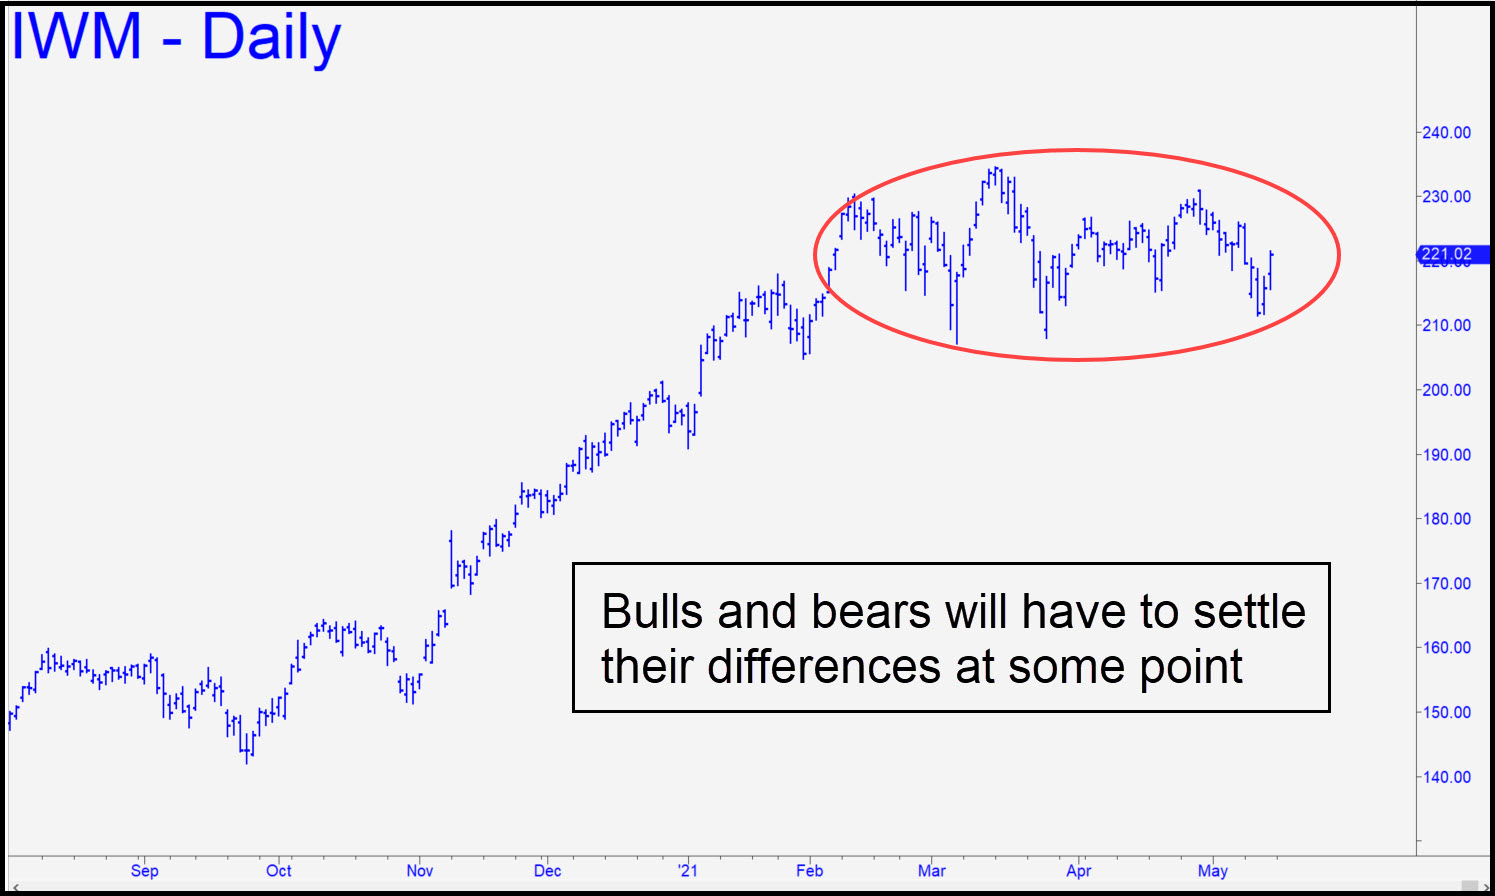
 Bulls and bears have been skirmishing since early February, and it remains to be seen who will prevail. To my eye, the now-deformed head-and-shoulders pattern shown in the chart looks distributive even if its earlier, indisputably bearish perfection has been compromised by May’s sideways tedium. If a bullish breakout is going to occur nonetheless, I would expect this to happen subsequent to a feint beneath Mach’s sub-210 lows. For the time being, however, I can offer you a 227.25 rally target. That is the ‘D’ coordinate of the reverse ABC pattern, on the daily chart, where a=215.24 on April 20. ______ UPDATE (May 19, 10:35 p.m. ET): If this hoax can fake its way up to the green line (x=219.64), short there ‘mechanically’ with a stop-loss just above C=223.24. ______ UPDATE (May 21): The short triggered, leaving us slightly in the red at the close. Hold to the 223.25 stop-loss for now, but cover half on a downdraft to p=216.18. The remainder can be held for a shot at D= 209.11. ______ UPDATE (May 25, 12:35 a.m.) The short appears all but certain to get stopped out just above 223.24. That would not diminish IWM’s appeal to anyone wanting to try again, but the required rabc set-up would be labor-intensive. _______ UPDATE (May 25, 11:14 p.m.): Wake me if this brick hits 225.94, which would generate a bullish impulse leg on the daily chart. ______ UPDATE (Jun 1, 3:09 p.m.): The update I sent out Monday night seems to have vanished into digital hyperspace. Anyway, I’d noted that IWM’s rally past 225.94 should have impressed no one. Let’s wait until such time as it fist-pumps above April 28’s 230.95 high before we give it the time of day.
IWM – Russell 2000 ETF (Last:228.45)
 Posted on May 16, 2021, 5:08 pm EDT
Last Updated June 1, 2021, 3:08 pm EDT
