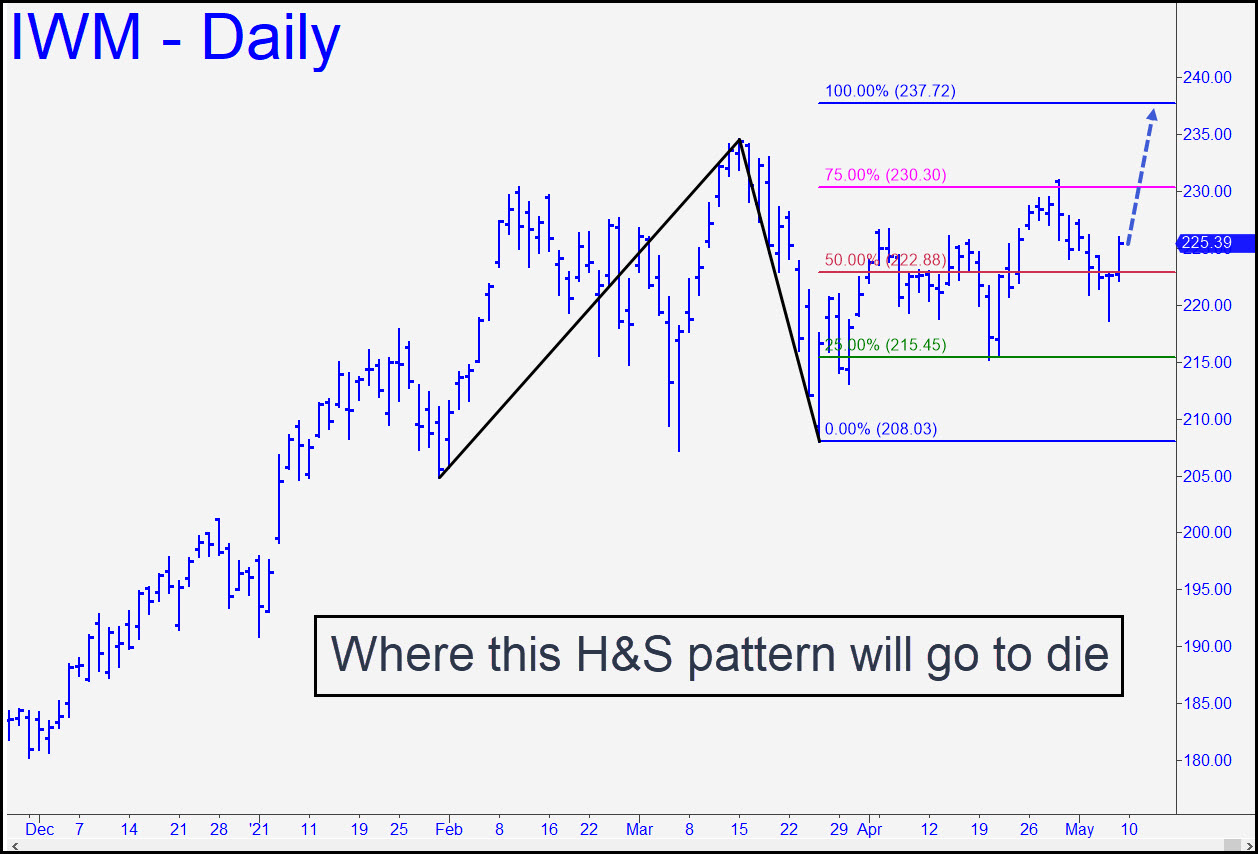
 The menacing head-and-shoulders pattern that promised a day or two of reckoning for giddy bulls has deteriorated with the extension of the right shoulder by an additional five daily bars. Since a failed head-and-shoulders top is implicitly bullish, I’ve redrawn the chart to show a gnarly pattern with a 237.72 rally target. It tripped a textbook-perfect mechanical buy signal at 215.45 on April 20, but I am not suggesting that the green line be re-used if IWM swoons again. I would, however, be moderately enthused about a p2 (pink line) entry if it is hit on a pullback from a high 3-4 points shy of D. _______ UPDATE (May 10, 5:24 p.m. EST): I’d like to see IWM take out the 208.03 low of the bullish pattern projecting to 237.72 before I wax enthusiastic again about the head-and-shoulders pattern. Let’s cross our fingers and hope for the worst. _______ UPDATE (May 13, 12:58 a.m.): Some subscribers hold the July 16 175/180/185 put butterfly for 0.10 or less based on a recommendation I made on April 18. Better yet, one subscriber legged on the position for a net CREDIT of 0.01 using my explicitly detailed instructions here a while back. The spread is worth about 0.15 as a result of this week’s plunge, but IWM will need to fall below 200 by early June before the spreads get perky enough to let us cash out of half for twice what we paid, as is our custom. Please let me know in the chat room if you hold the spread so that I can gauge subscriber enthusiasm for it. [Not high, evidently, since only three subscribers have reported positions. I will continue to offer tracking guidance nonetheless.]
IWM – Russell 2000 ETF (Last:212.45)
 Posted on May 9, 2021, 5:17 pm EDT
Last Updated May 13, 2021, 6:21 pm EDT
