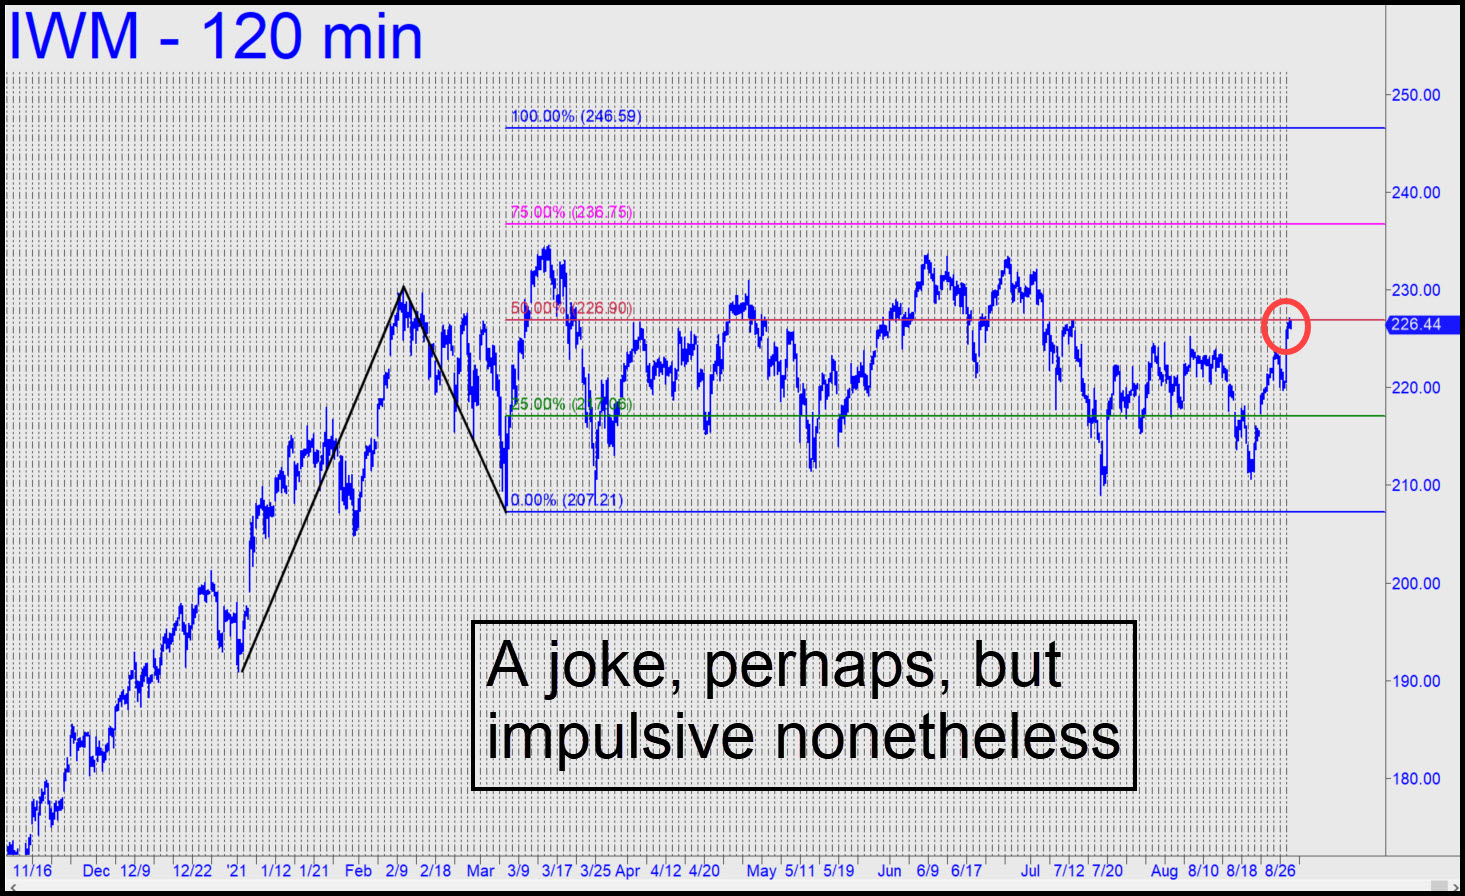
 In the Trading Room on Friday, “Statman” spotlighted a breakout in this vehicle, waking me from a long slumber. His breakout indicator probably differs from mine, since I’m focused on an intraday high that exceeded mid-July’s 226.81 ‘external’ peak by all of 22 cents, or about a tenth of one percent. But a breakout is a breakout, and so I’ve redrawn the chart to show what could happen if IWM is in fact beginning a big move in a very sneaky way. You can butterfly one-month calls near the 245 strike if that is your style, but we’ll also look for intraday opportunities to board the underlying, provided there is a good show of interest in the chat room. (If you are new to Rick’s Picks and butterfly spreads, use your account dashboard to access a free recorded lesson on how to do these spreads in our idiosyncratic, super-leveraged way.) _______ UPDATE (Sep 7, 10:06 p.m.): So far, price action has been garbage, with no even remotely interesting buying opportunities in more than a week._______ UPDATE (Sep 8, 9:02 p.m.): I’ve lost interest in attempting a ‘mechanical’ buy if IWM returns to x=217.06, since it would amount to ‘sloppy fifths’.
IWM – Russell 2000 ETF (Last:223.91)
 Posted on August 29, 2021, 5:15 pm EDT
Last Updated September 8, 2021, 9:00 pm EDT
