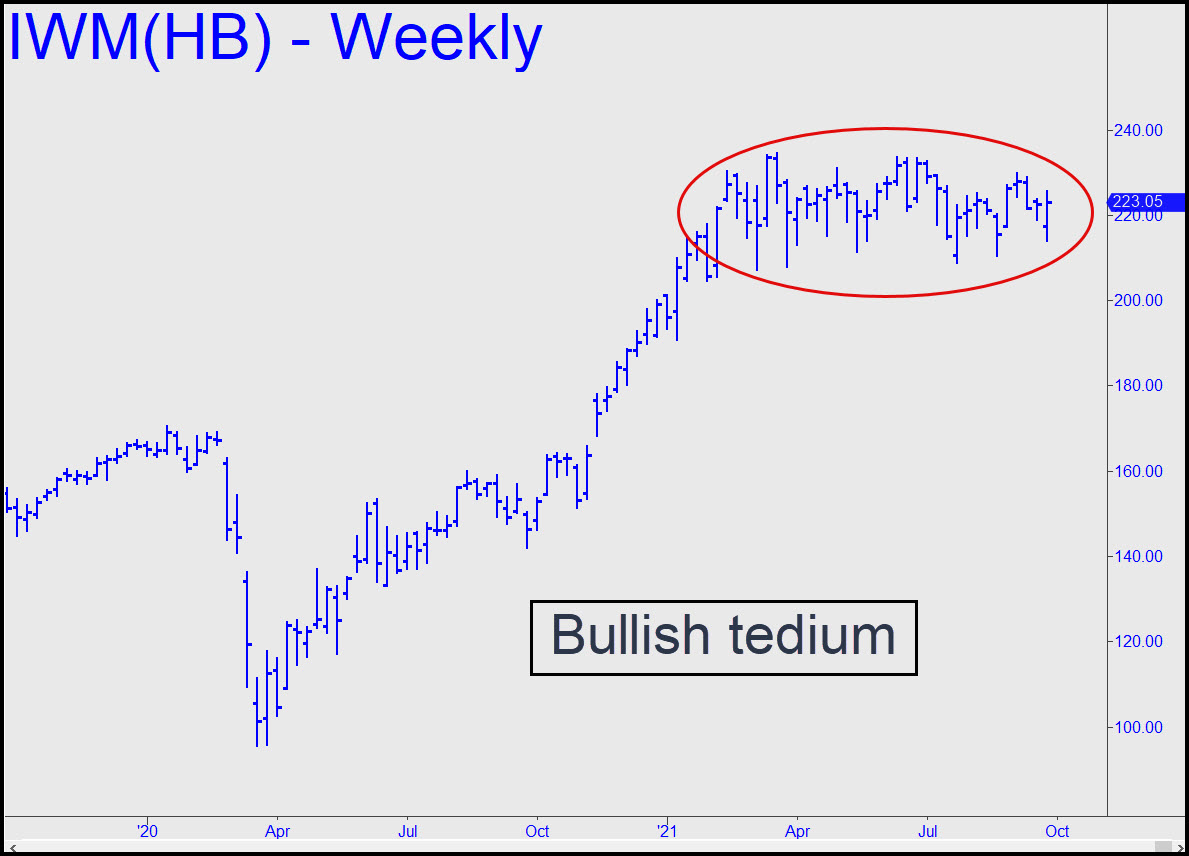
 The pattern shown is a presumable bullish consolidation that seems in no hurry to reward patient investors. To my eye, a breakout seems likely to occur in either of two ways: 1) with a feint lower that breaches at least one of the four lows that have been recorded this year, or 2) a lurch higher that exceeds the ‘external’ peak at 233.64 recorded on 6/11. However, a rally that gets between that peak and the more recent one at 229.84 (9/3/21) would be irresistible as a possible shorting opportunity. We will attempt it if the set-up pans out, while acknowledging that a profitable trade would not necessarily signal the beginning of the end for this ‘value’-stock index. _______ UPDATE (Sep 29, 9:47 p.m. ET): I commented on the constipated tedium of this vehicle in the chat room today. Check out my posts in the Trading Room starting at 2:13 p.m. for the details. _______ UPDATE (Sep 30, 7:12 p.m.): IWM came to rest sitting on the 218.55 target of the pattern shown. When it fails, which it will, look for more downside to the soon-to-become magnetic low at 214.22. If the low is tested before noon, a half-hearted rally would signal a relapse and probable close beneath the low.
IWM – Russell 2000 ETF (Last:218.70)
 Posted on September 26, 2021, 5:09 pm EDT
Last Updated September 30, 2021, 11:14 pm EDT
