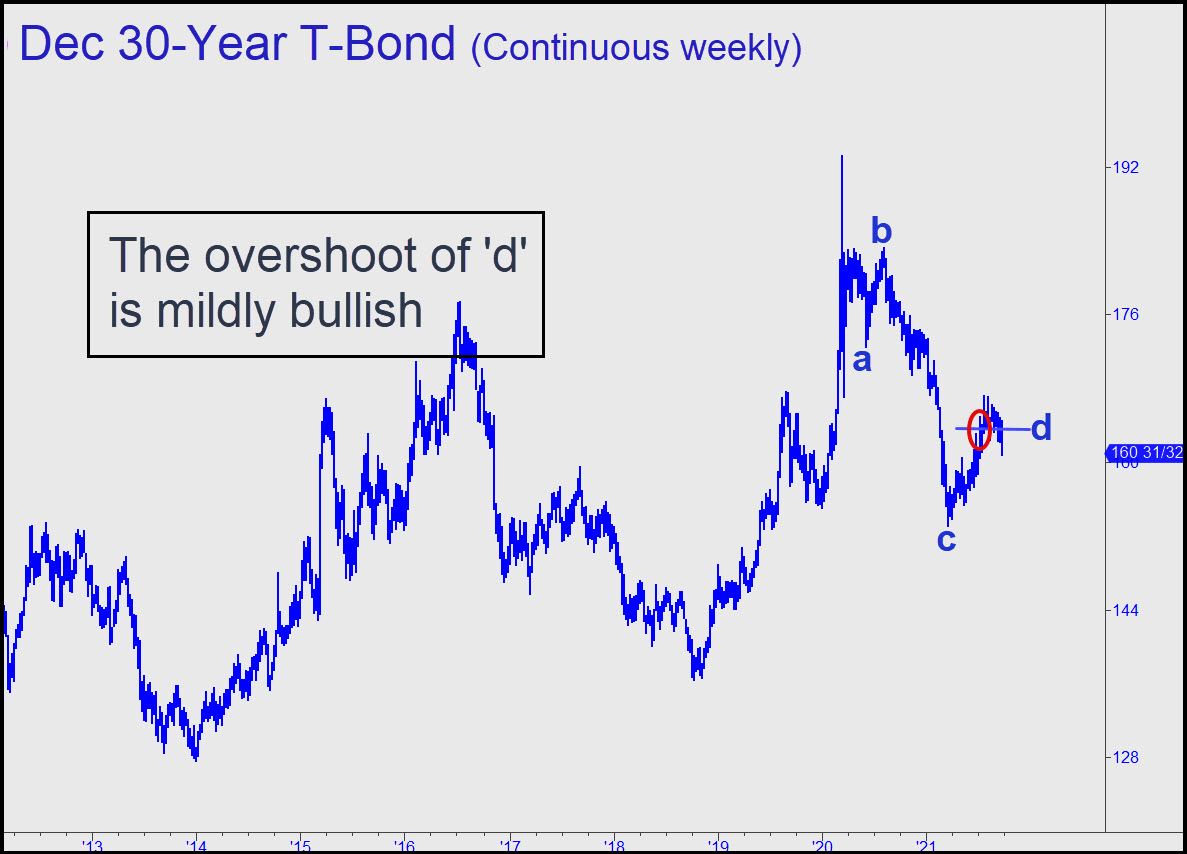
 Are T-Bonds in a bear market, or merely consolidating a longer-term bull? A weekly chart going back to 2012 yields a mixed picture, albeit one that is tradeable. The uptrend begun six months ago is bullish insofar as it exceeded the ‘d’ target of the rABC pattern shown (see inset). But it is coming off a low that broke a major support from January 2020, creating an impulse leg almost as powerful as the bullish one that spiked the futures to spectacular heights when the pandemic first hit in March 2020. Some traders will also see the contours of a very long-term head-and-shoulders pattern in this chart. I am not a big fan of them, although I’d have to concede that imposing one here is relaxing — which is to say, mildly persuasive — to the mind’s eye. For trading purposes I’ll suggest using this bearish pattern begun from a small peak last January. It suggests minimum downside to 158^09 over the near term. We’ll reassess trend strength once we’ve seen how sellers interact with that Hidden Pivot support. _______ UPDATE (Sep 29, 9:34 p.m. ET): The futures are struggling to put in a bottom somewhat above the 158^09 target given above. It remains theoretically viable, but for now we’ll just have to see how it goes. It would be bullish for the intermediate term if a rally takes out some prior highs on the hourly chart without having dipped to 158^09 first. The nearest such peak lies at 160^27.
USZ21 – December T-Bonds (Last:159^23)
 Posted on September 26, 2021, 5:17 pm EDT
Last Updated October 4, 2021, 10:47 am EDT
- September 27, 2021, 12:35 pm

VGLT Target + 29 %
From 88.53 to 114
With 1.8 % Long-Term Treasury Yield