
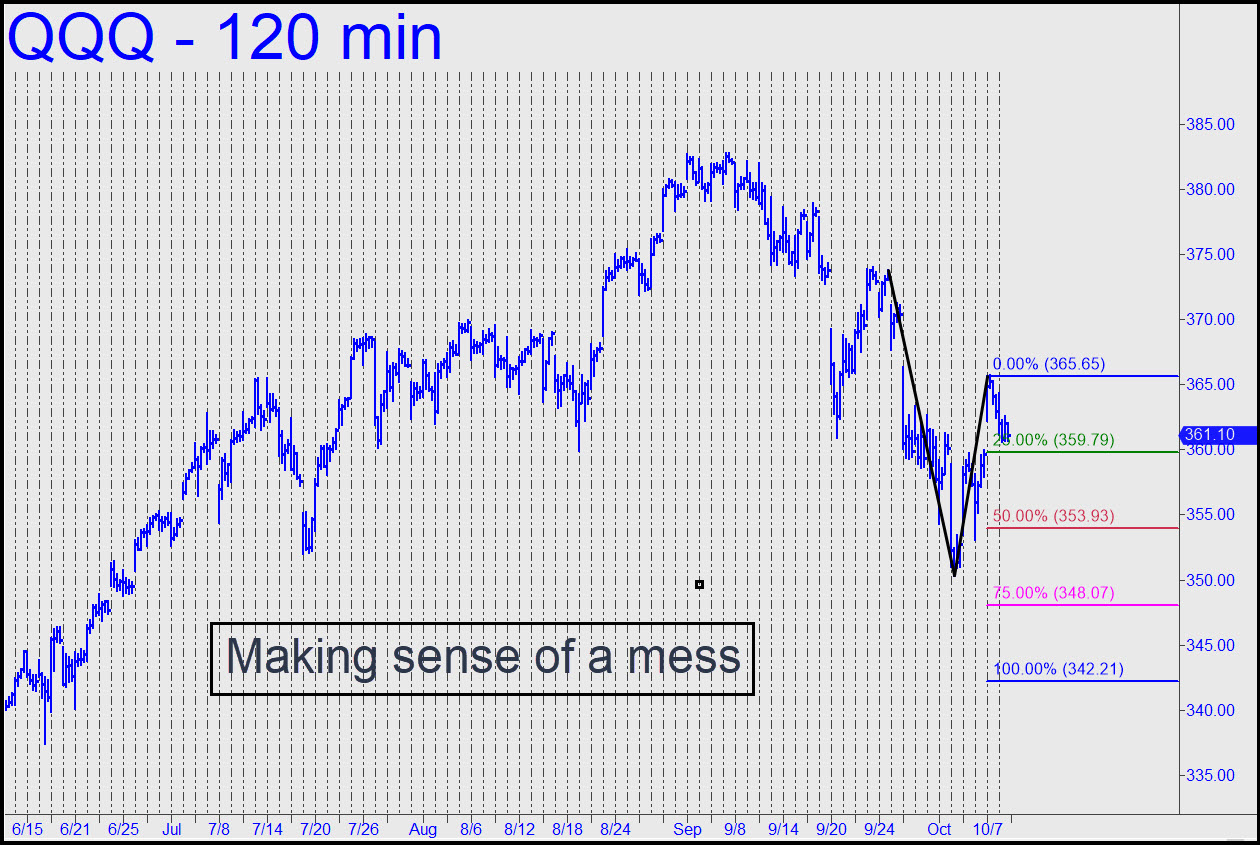
 Price action last week was as agitated as we’ve seen in a while, with bulls and bears locked in a seeming fight to the death. We’ll side with the latter for now, but only for purposes of drawing a chart we can use to assess trend strength in either direction. If the ‘C’ high at 365.65 is taken out as the week begins, I’ll likely redraw the graph to reflect a stronger bullish bias. For now, though, we can look for Friday’s moderate weakness to continue. If it sends the Cubes down to p=353.93, you can bottom-fish there with a very tight stop-loss. Call options might work if the upturn is sharp enough, but don’t go out more than a week, and use options priced for 0.60 or less. _______ UPDATE (Oct 14, 11:15 p.m.): Today’s short-squeeze spasm above the ‘C’ high of the bearish pattern has generated a rally target at 369.02 (15-min, a=353.15 on 10/6 at 10:35 a.m.). Let’s see how the herd handles it on a Friday.
QQQ – Nasdaq ETF (Last:366.60)