
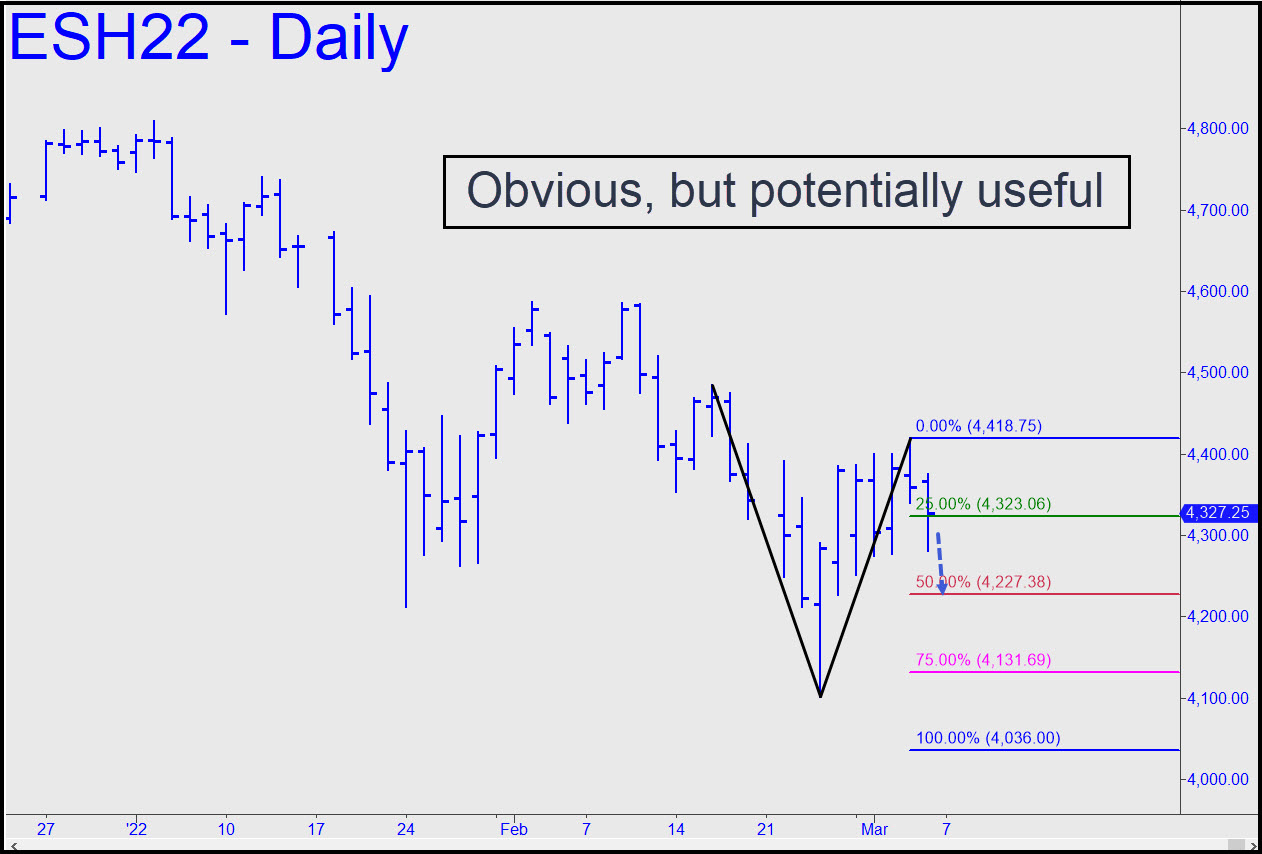
 Last week’s high fell almost precisely at the ‘D’ target of a middling rABC pattern, presumably maxing out the upside for the moment, and that is why we can use the bearish pattern shown to get a handle on this vehicle in the week ahead despite its obviousness and plain-vanillaness. Most immediately, that would imply bottom-fishing at p=4227.38 as a tightly stopped scalp-trade, and subsequently shorting at the green line (x), assuming it’s hit via the right kind of bounce. For now, use 4227.38 as a minimum downside target for the near term. _______ UPDATE (Mar 7, 9:49 a.m. EST): It is unusual and mildly disconcerting for a perfectly located, 4227.38 midpoint support to have failed to gift us with a bottom-fishing trade. The futures fell to within an inch of the trigger price, then bounced sharply. The HP Method ‘textbook ‘ provides two possible explanations: 1) the droolers and algos have finally begun to recognize the usefulness of this key HP level; or, 2) buying power is waxing and was too strong to allow a correction to reach p. I lean toward the latter interpretation, but without necessarily having it negate the former. The implication is that this rally will at least exceed C=4418.75. Here’s the chart. [Further update, 10:40 a.m.: The bounce reached the green line (x=4323.06), but it did not qualify as a ‘mechanical’ short, since the bounce was coming off a low that had failed to touch p.] ______ UPDATE (Mar 7, 7:40 p.m.): Considering what’s going on in the world, sellers looked most unimpressive as they batted down the futures a measly 146 points. When they come to their senses, look for the S&Ps to fall 400-600 points in a day, an event that would be commensurate with the excesses that have preceeded it. In the meantime, expect more downside to at least 4036.00, the target shown in the original chart. It looks all but certain to be achieved because of today’s decisive breach of p=4227.38 and the close well below it. If it, too, fails as support, we’ll be looking at 3935.00 (move ‘A’ up to 4585.00 to see it). You can try bottom-fishing at either pivot, provided you’ve been short on the way down. One final note: The midpoint support associated with that last number is 4177.00, so be prepared for a short-squeeze bounce from very near there. _______UPDATE (Mar 9, 9:30 p.m.): The short squeeze unfolded almost precisely as expected, goosing the futures 160 points to a so-far high at 4298.25. In the chat room and in an intraday Notification sent out to subscribers, I mentioned a possible ‘reverse-pattern’ short from 4300 that was discussed in greater detail during today’s tutorial session. Another short geared for less experienced traders can be attempted with the point ‘c’ high anchored near 4323. See the Notification for additional details. _______ UPDATE (Mar 10, 11:46 p.m.): The night-shift dirtballs look like they’re struggling at the moment to shake down and exhaust sellers so that they can rig Friday’s opening. Their failure seems bullish to me, but if the futures open on a strong short-squeeze, I’d be tempted to fade the rally. Please nudge me in the chat room about this if I happen to be around.
ESH22 – March E-Mini S&P (Last:4278.25)
Posted on March 6, 2022, 5:20 pm EST
Last Updated March 10, 2022, 11:46 pm EST
- March 11, 2022, 10:10 am
-
March 10, 2022, 4:43 am
Awesome, Rick. As a less experienced trader simply looking for sentiment gauge and possible up and down trigger points to buy put or call options (sometimes both!), THIS is the guidance of which I am looking. I’m close to subscribing even at full price!
The S & P fart fume rally does not look t0 be able to last even until the afternoon. I’m holding on to my two S & P put spreads. I bought a Gold spread after the $30 drop correction you cautioned could happen before more upside.