
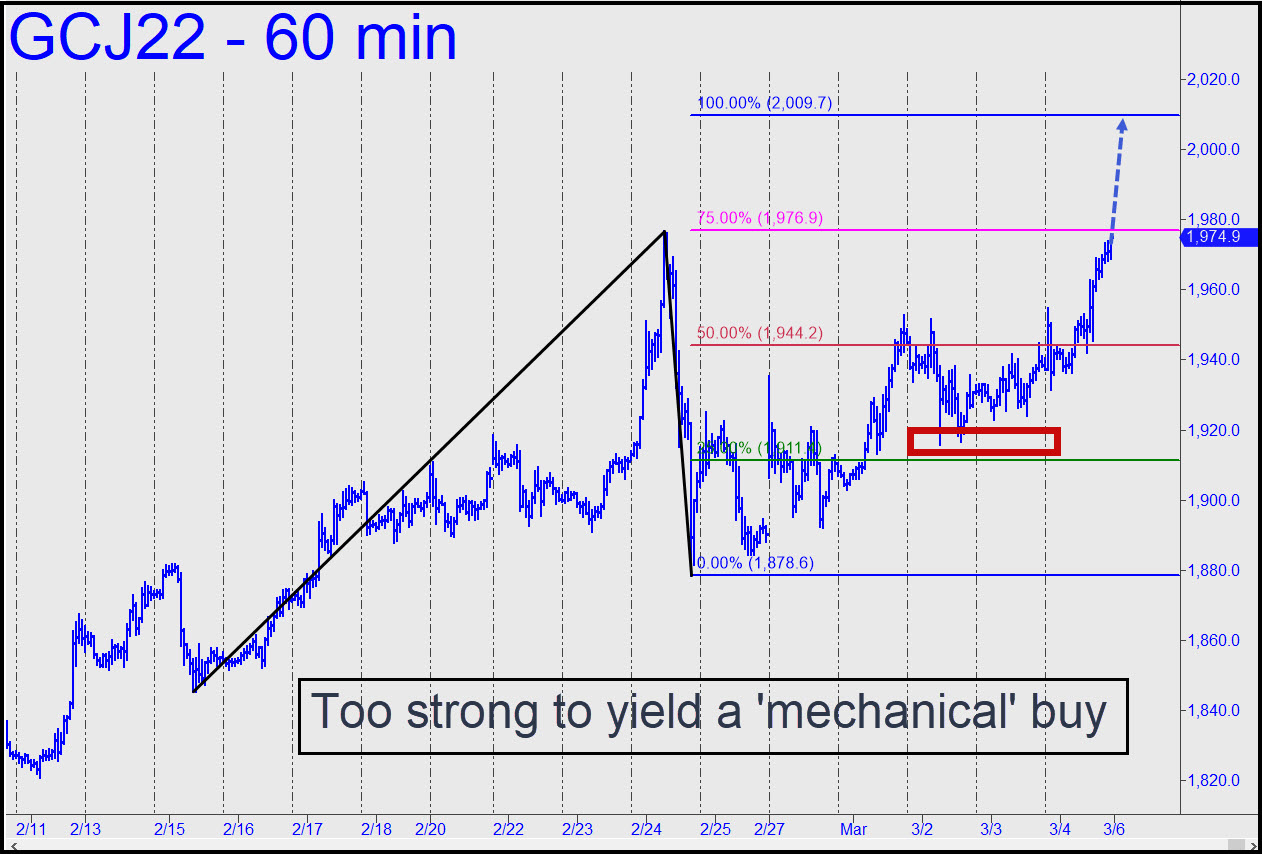
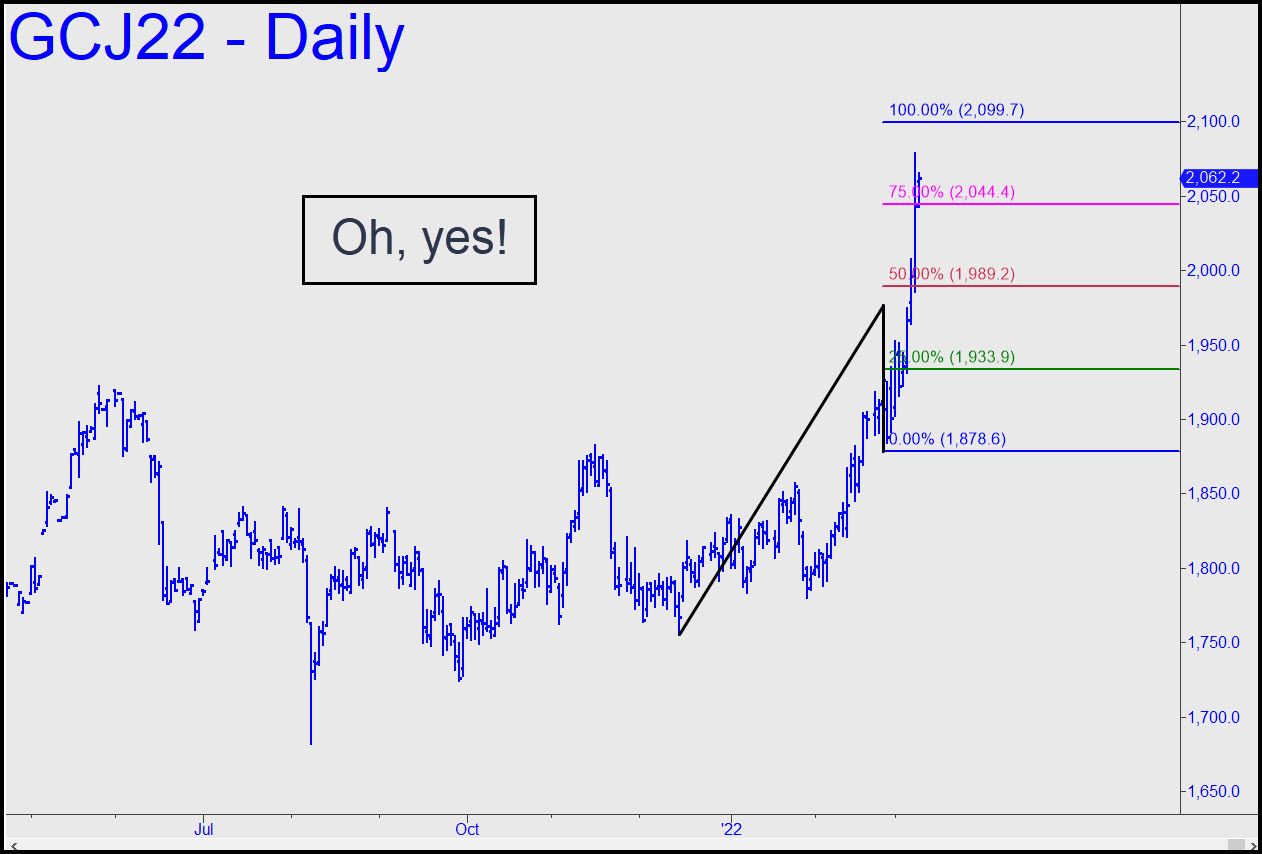
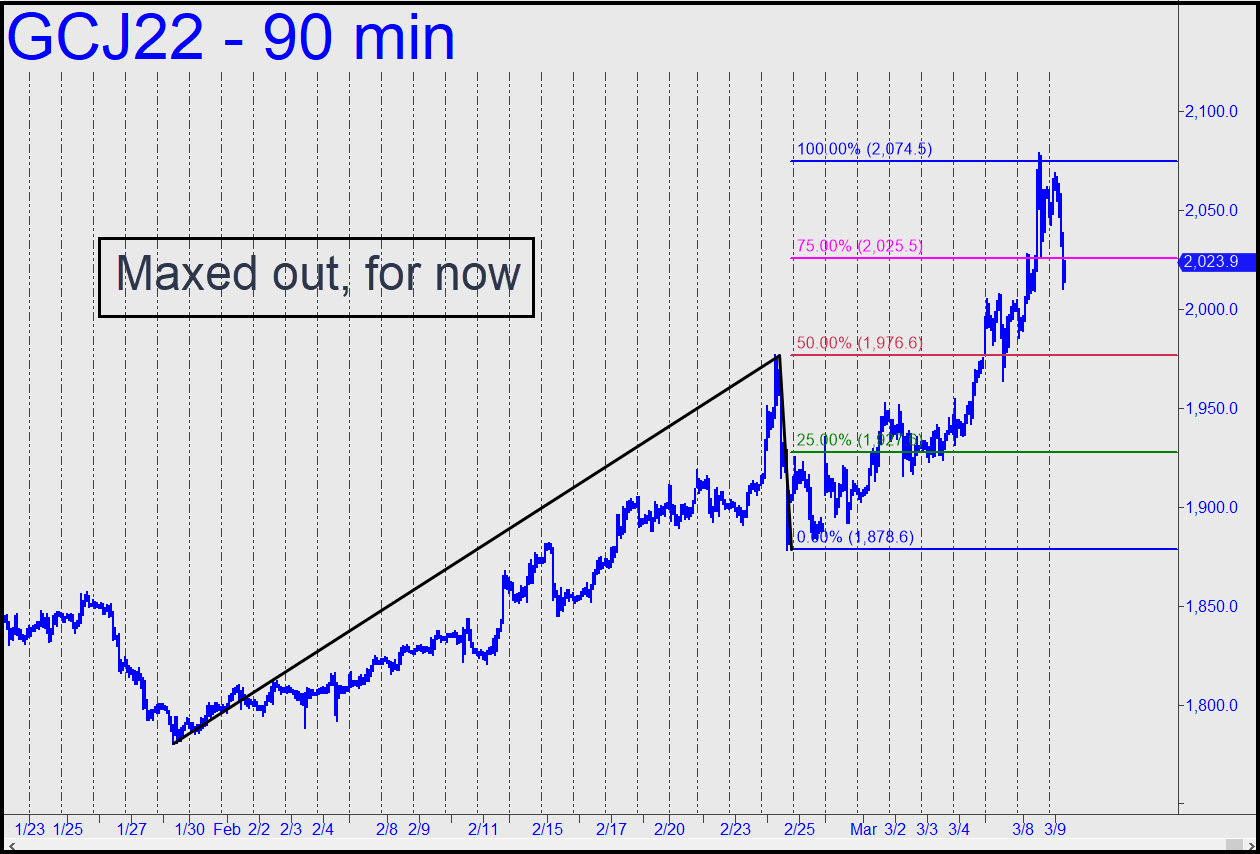
 Buyers didn’t exactly obliterate the 1944.20 midpoint resistance on their first attempt to get past it last week, but the futures subsequently appeared to pick up strength when they failed to pull back to the green line (x=1911.40) to gift us with a ‘mechanical’ long. The implication is that the futures are bound for D=2009.75 and all but certain to achieve it. A pullback to p=1944.20 first would trigger a ‘mechanical’ buy with a stop-loss at 1922.30. We can cut the risk down to size in real time, so be sure to tune to the chat room for further guidance when the futures get close to the target. _______ UPDATE (Mar 7, 9:54 a.m. EST): Gold has topped overnight (when else?) a tenth of a percent from the $2009.75 target flagged above. Using the visual technique I detailed in the chat room last week, this was close enough to have set up a low-risk, reverse-pattern short or a precise exit from a long. Anyone do the trade? In any event, here’s the chart. The so-far low of the reversal is 1964.20, a $43 drop from the high. _____ UPDATE (Mar 8, 8:52 a.m.): Ya gotta love the way gold thumbed its nose at the very-round-number resistance, $2000! The next Hidden Pivot resistance lies at 2034.80 within a pattern on the daily chart that dates back to A= 1821.10 (2/11). It will max out at 2066.60 (A=1788.50 on 2/3). _______ UPDATE (Mar 8, 10:42 p.m.): How nice to see gold acting like a FAANG stock! I’ve used the highly unconventional pattern shown in this chart to project minimum upside over the near term to 2099.70. _______ UPDATE (Mar 9, 7:23 a.m.): I’ve ‘discovered’ a new pattern that should have been more obvious to me initially and which somewhat changes my outlook for the near term. It suggests the futures may have maxed out the rally, at least for the time being, with the recent high at 2078.80. This Hidden Pivot lies two-tenths of a percent from the 2074.50 target shown in this chart. The 2099.70 target will remain viable nevertheless, but getting there may require a substantial correction first. We’ll be better able to judge how substantial once we’ve seen whether minor corrective patterns start exceeding their p midpoint supports, or perhaps their ‘d’ targets.
GCJ22 – April Gold (Last:2064.60)
Posted on March 6, 2022, 5:15 pm EST
Last Updated March 9, 2022, 7:24 am EST