
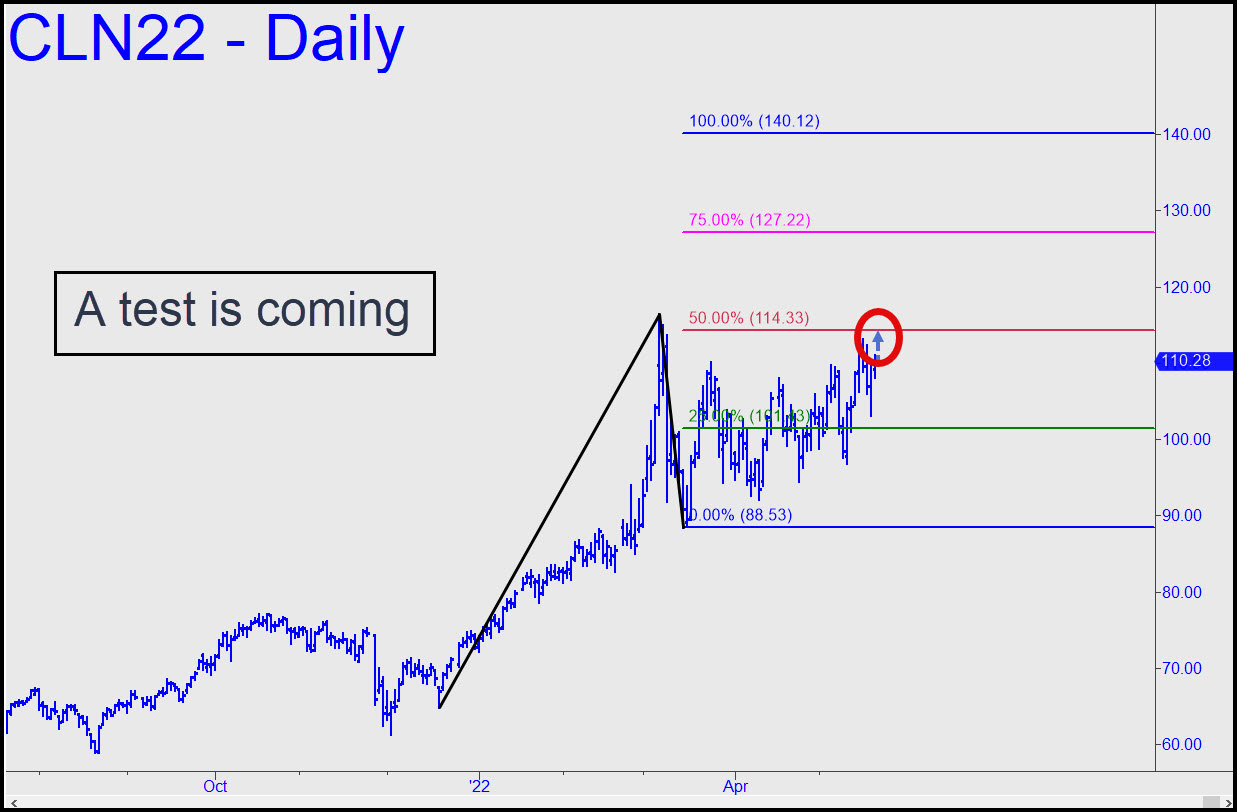
 I am unable to find the pattern shown in Edwards and Magee’s supposedly definitive book on technical analysis. None of their wedges, pennants, channels, flags or triangles exhibit the seeming power of this one, with its rising whatchamacallit juxtaposed against Q1’s mountainous upthrust. There may be no precedent for such a globally important commodity as crude oil exhibiting this kind of behavior. But could the rally simply reverse nonetheless, sending quotes plummeting to levels that would be commensurate with the worldwide recession/depression that is brewing? I have been conflicted over this question, having argued both sides of it in recent commentaries. For the sake of clarity, however, I will treat the chart as I would any conventional ABCD, relying mainly on price action at the midpoint Hidden Pivot, 114.33, to tell us what is going on. It may turn out that last week’s high, which fell 1.04 shy of C-D’s midpoint, will turn out to have been an important top. If not and the futures popped through it this week, that would reinforce the case for a continued rally to as high as 140.12. Since that seems impossible with the current collapse in China’s manufacturing sector, it can only imply, as I noted here earlier, that a catastrophic disruption in supply is looming. _______ UPDATE May 26, 5:42 p,m.) The futures poked slightly above the 114.33 midpoint resistance, but this is not technically significant. Let’s see what the next day or two brings.
CLN22 – July Crude (Last:114.26)
Posted on May 22, 2022, 5:23 pm EDT
Last Updated May 26, 2022, 5:40 pm EDT