
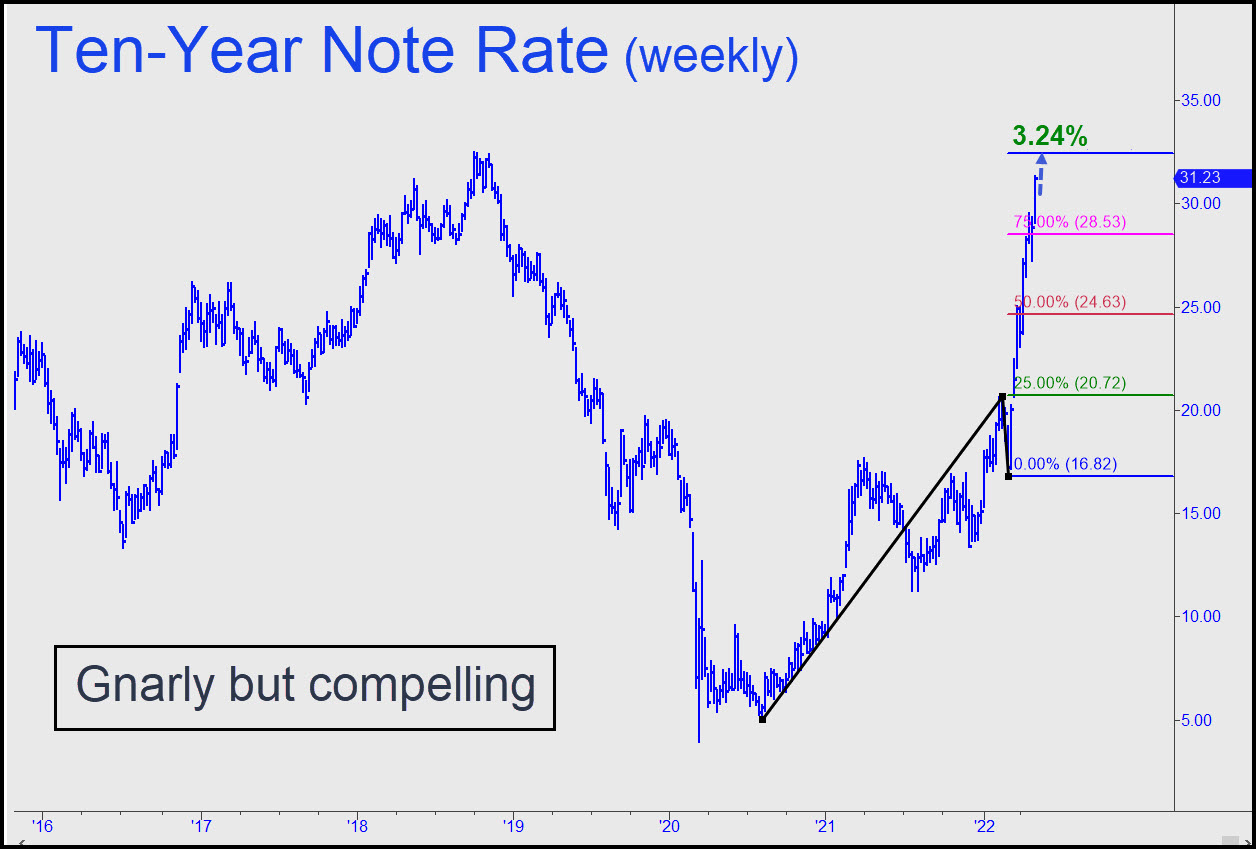
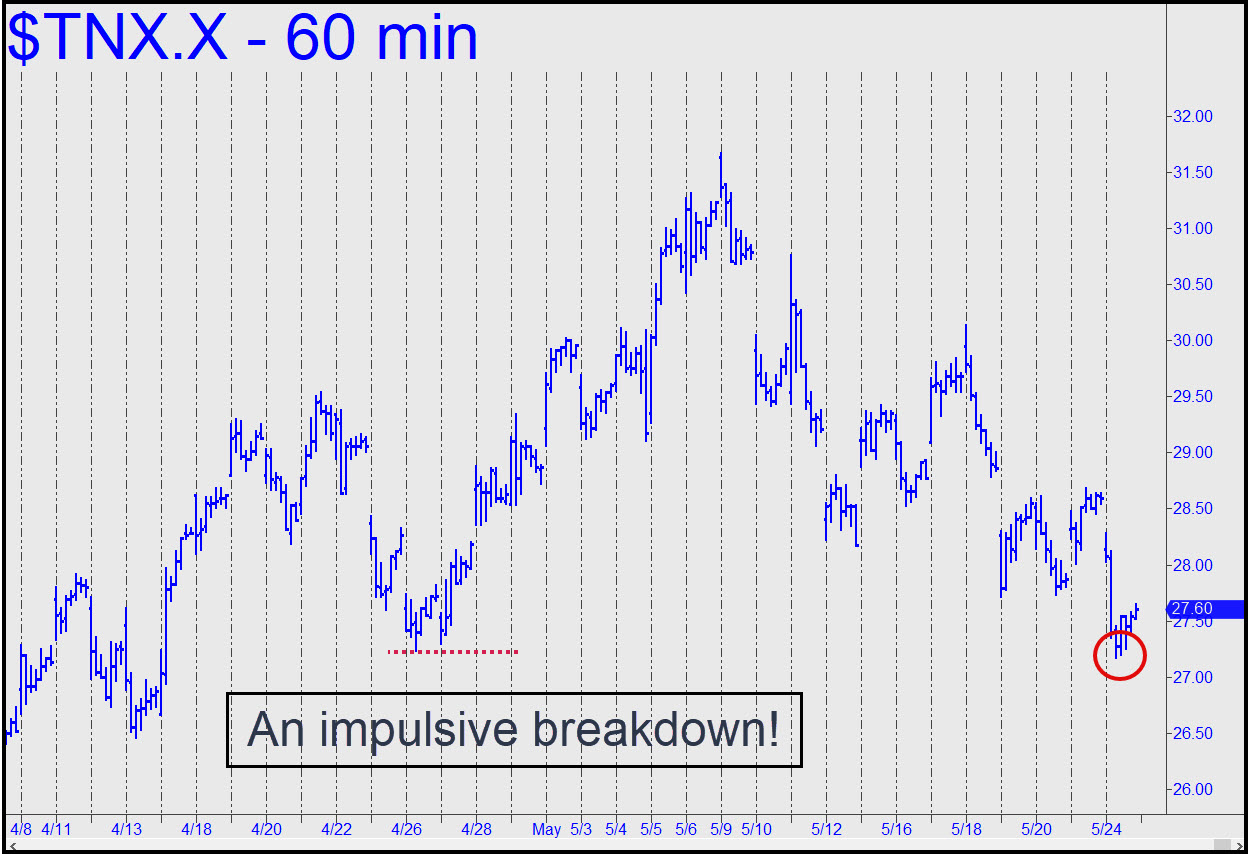
 With long-term rates closing like a missile on my 3.24% target for the U.S. Ten-Year Note, I was compelled to double-check my math. The chart not only confirms the validity of the target, it offers a bigger-picture perspective on an ABCD pattern that is as gnarly as it is compelling. I’d previously used a daily chart to project an identical target, but the fact that the same persuasive, rules-based elements are present on the weekly chart makes 3.24% the number to watch. It is not short-able with the usual precision because its stopping power will be conflated with that of a top made in the same place in October 2018. I have more to say about this in this week’s Morning Line commentary, so check it out if your curious about what a top in Treasury rates could mean for the U.S. economy. _______ UPDATE (May 24, 10:14 p.m. EDT): A slight breach of the 2.72% low recorded on April 26 corresponds to TLT’s inverse poke above a small ‘external’ peak recorded around the same time. Have interests rate seen their high? It’s possible, but the evidence is not yet decisive. It would imply that the recession that began months ago — the one Goldman’s resident genius said a few weeks ago had a 15% chance of occurring within the next 12 months — is beginning to deepen. Here’s the chart.
TNX.X – Ten-Year Note Rate (Last:2.76%)
Posted on May 8, 2022, 5:22 pm EDT
Last Updated May 24, 2022, 10:15 pm EDT