
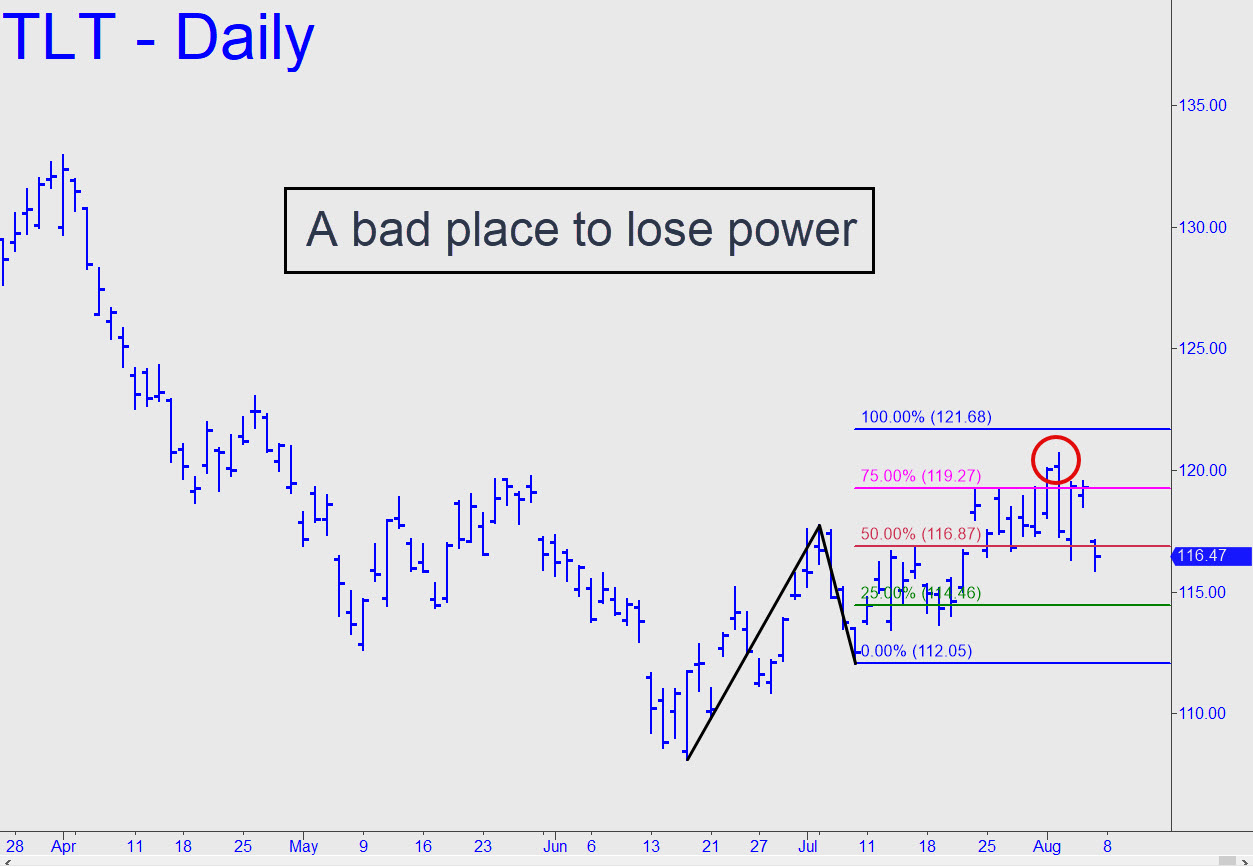
 The rally from mid-June’s 108 low would appear to have sputtered out in a bad place, just shy of the 121.68 ‘D’ target shown in the chart. The target remains viable nonetheless, and there are reasons why we should give it the benefit of the doubt. The most important is that the last portion of the upthrust exceeded an ‘external’ peak at 119.74 recorded in May, generating a robust impulse leg of daily-chart degree. Also, when TLT popped through the midpoint support at 116.87 after a week of trying, it built a base for a presumptive thrust to D. Last week’s close beneath the ‘launching pad’ was not exactly a sign of robust health, but I see it as exhaustion selling related to the way in which the charlatans who run the central bank mismanaged our expectations’ last week. The official story that the economy is doing okay and reality have moved widely apart, but the recession is real and will continue to exert downward pressure on yields. They are already high enough to snuff the economy worse than in 1973-74. Falling energy prices will help to somewhat mitigate the effect, but they will not reverse it. TLT in any event would trigger a ‘mechanical’ buy if the pullback hits x=114.46. _______ UPDATE (Aug 11, 5:15 p.m.): The savage intensity of the selling has diminished my enthusiasm for a ‘mechanical’ buy that triggered today at x=114.49. Another factor that put me off is the weak, meandering impulse leg. Let’s spectate for now.
TLT – Lehman Bond ETF (Last:114.39)
Posted on August 7, 2022, 5:09 pm EDT
Last Updated August 11, 2022, 5:14 pm EDT