
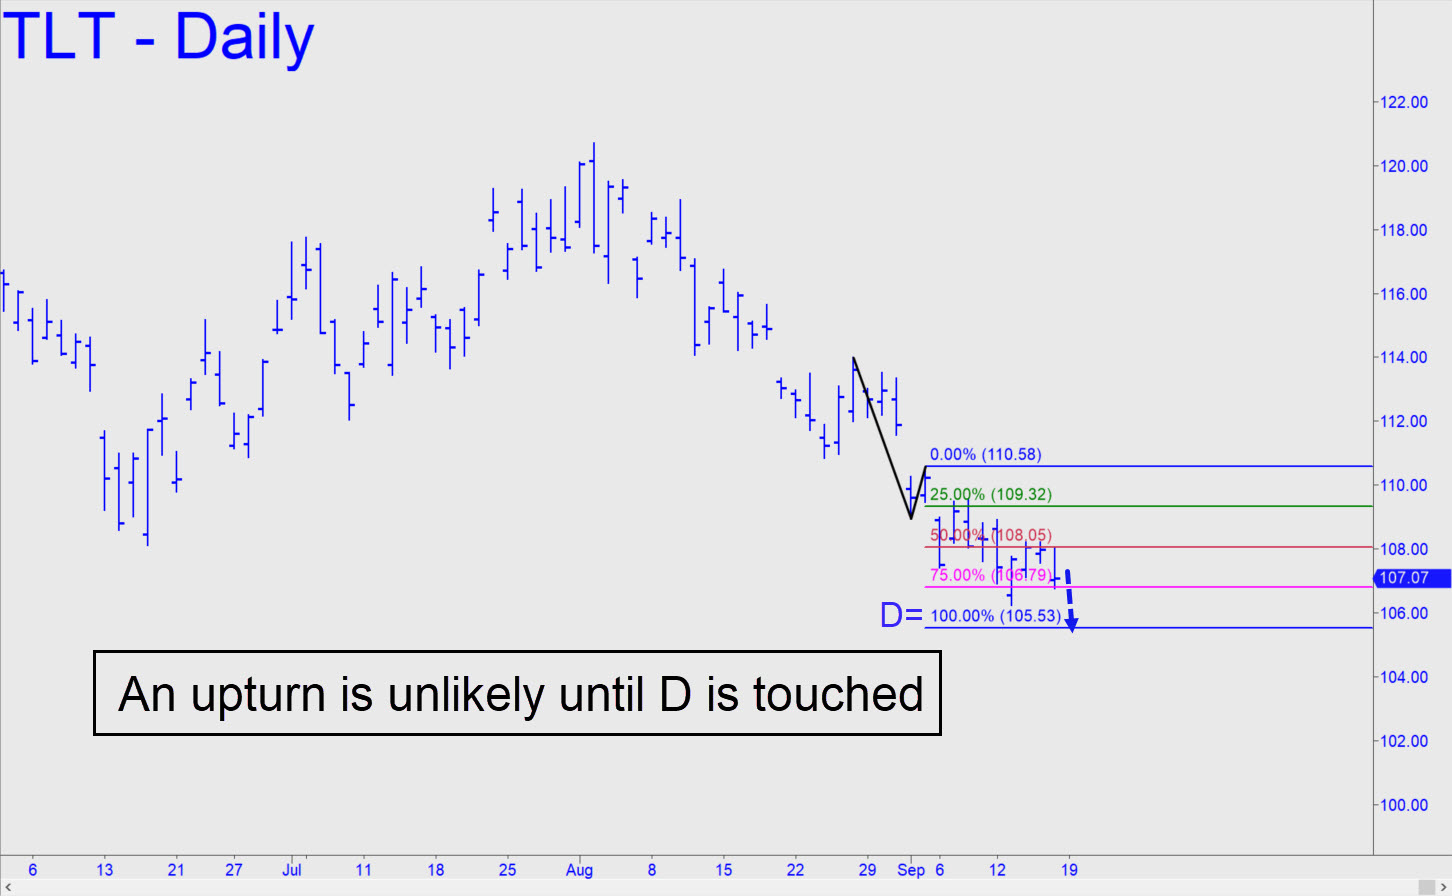
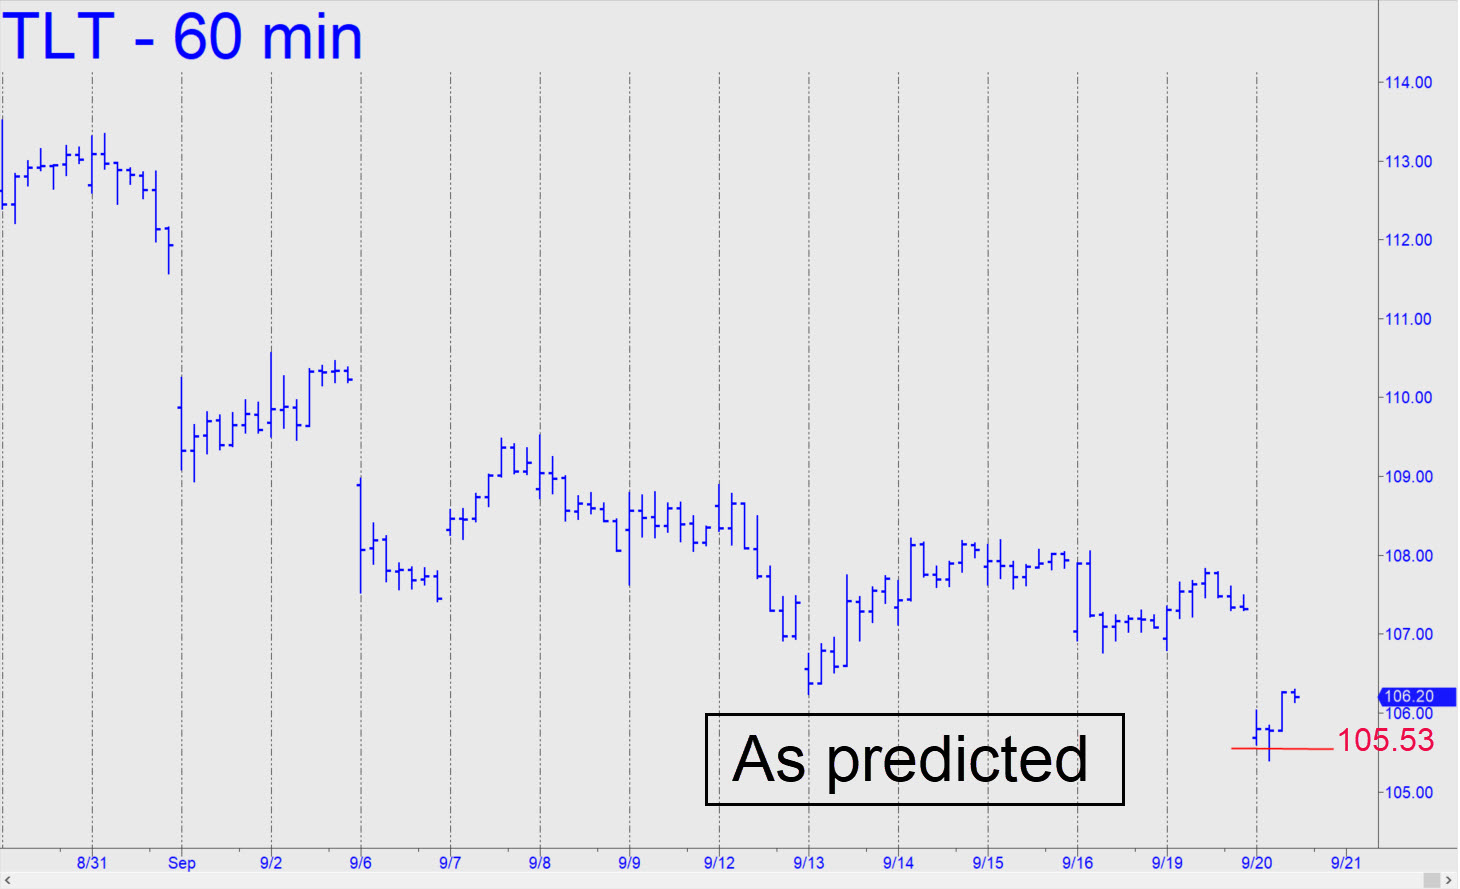
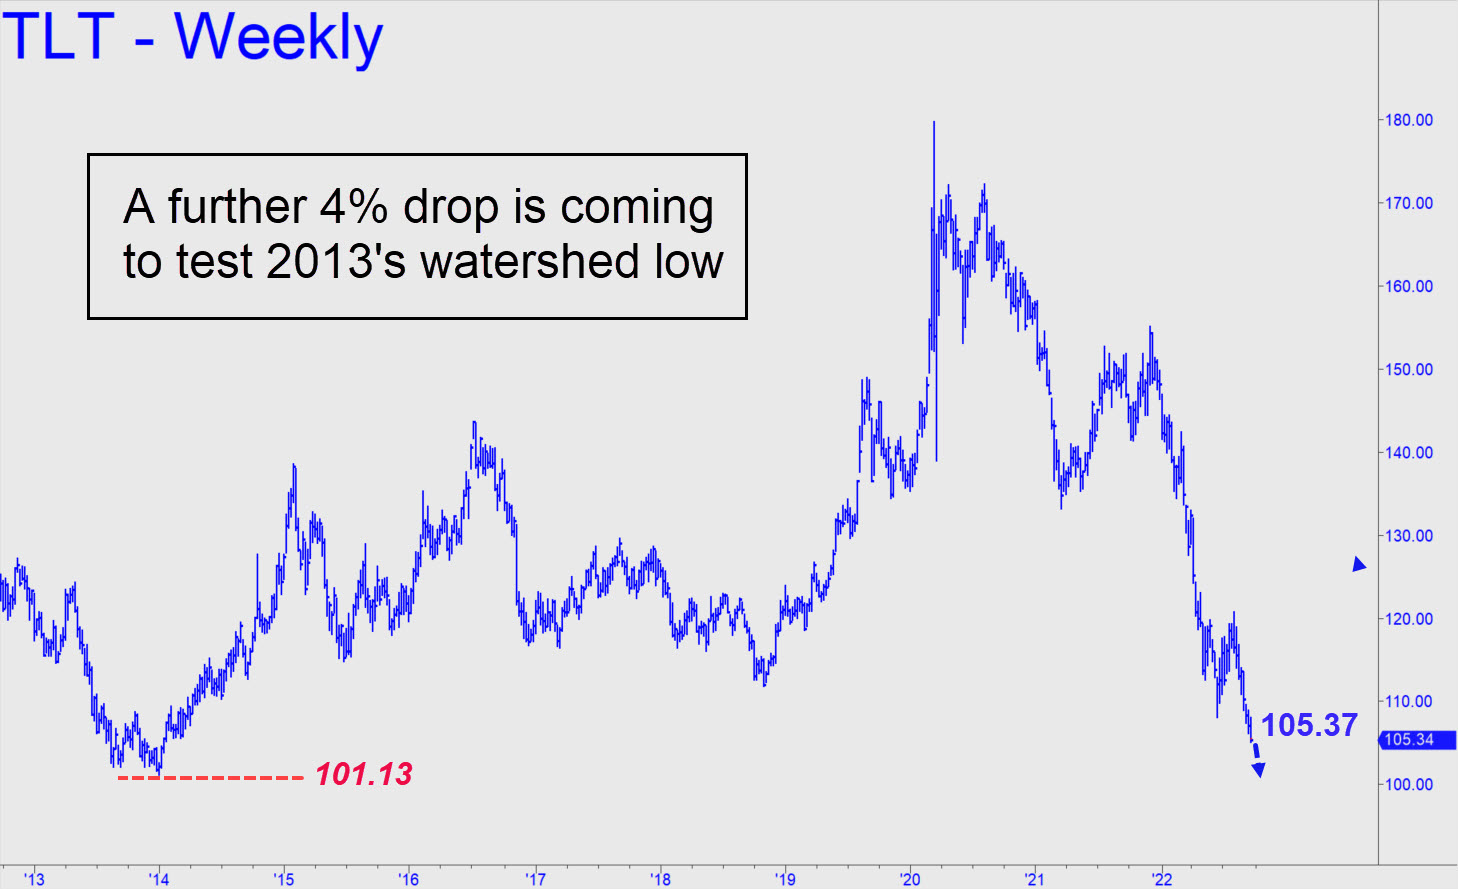
 Use the 105.53 target of the pattern show as a minimum downside objective for now. It seems likely to produce a tradeable bounce, if no more, since the pattern has already worked twice for initiating profitable ‘mechanical’ shorts. My hunch is that any bounce from this ‘hidden support’ will be short-lived and that TLT will subsequently relapse to new lows. I will continue to monitor price action in this symbol closely, since gold will remain under pressure as long as TLT, which correlates inversely with Treasury yields, is falling. ______ UPDATE (Sep 20, 12:55 p.m.): TLT has taken a so-far 94-cent bounce after plummeting to within an inch of the 105.53 target billboarded above. Subscribers have reported covering shorts there profitably, but it’s too early to tell whether the reversal will get legs. _______ UPDATE (Sep 21, 7:51 p.m.): The bounce showed some ‘leg’ today, that’s for sure. Let’s see how bulls handle three (!) ‘external’ peaks immediately above. They lie, respectively, at 108.21, 109.52 and 110.56. An uncorrected blast exceeding all of them would imply that a powerful recovery is under way. _______ UPDATE (Sep 22, 10:16): Treasurys have gotten smacked down brutally today, implying this vehicle will grope its way down to the 2013 low at 101.17 in search of support. Here’s the chart.
TLT – Lehman Bond ETF (Last:105.88)
Posted on September 18, 2022, 5:10 pm EDT
Last Updated September 22, 2022, 10:15 am EDT