
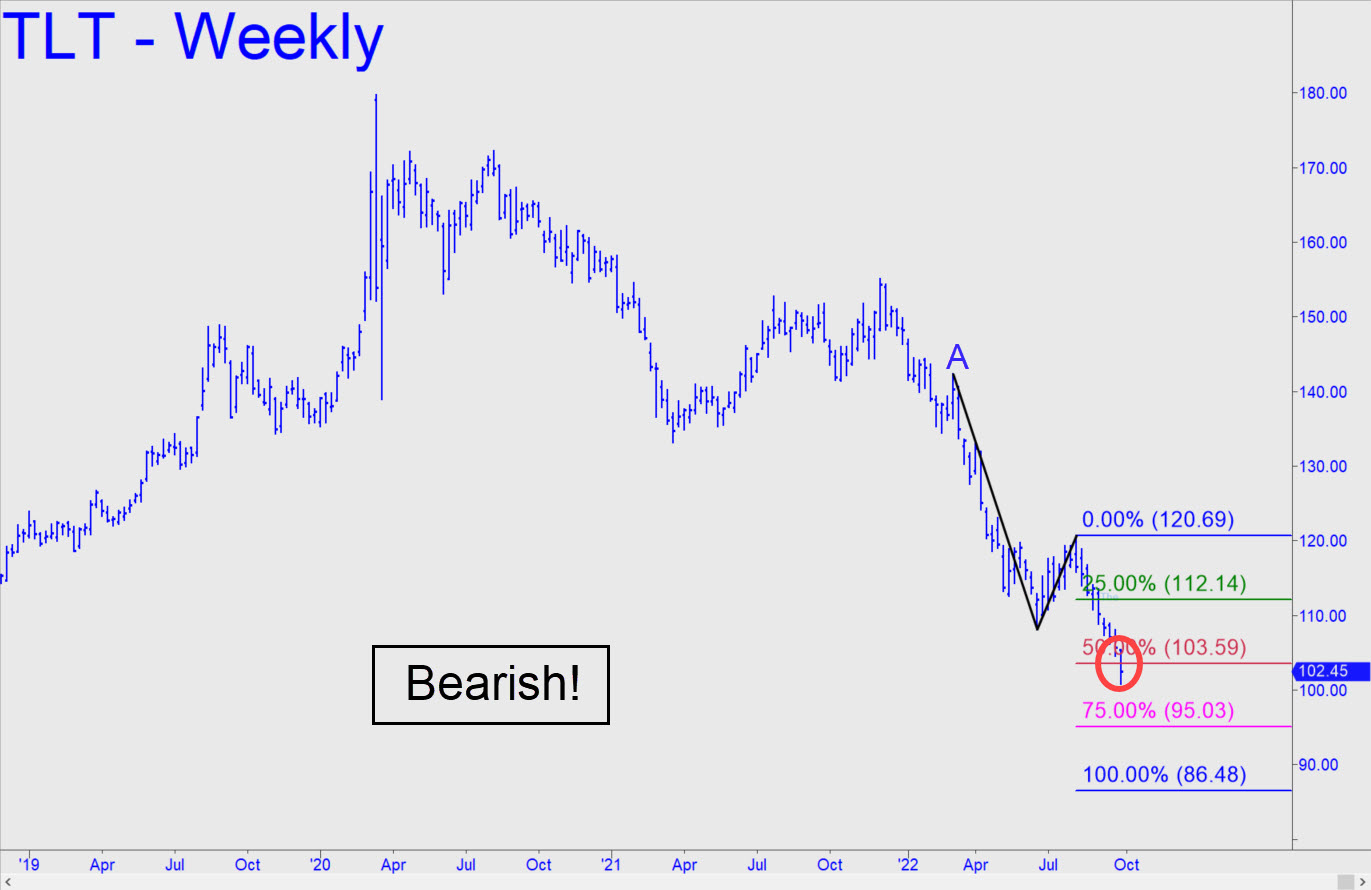
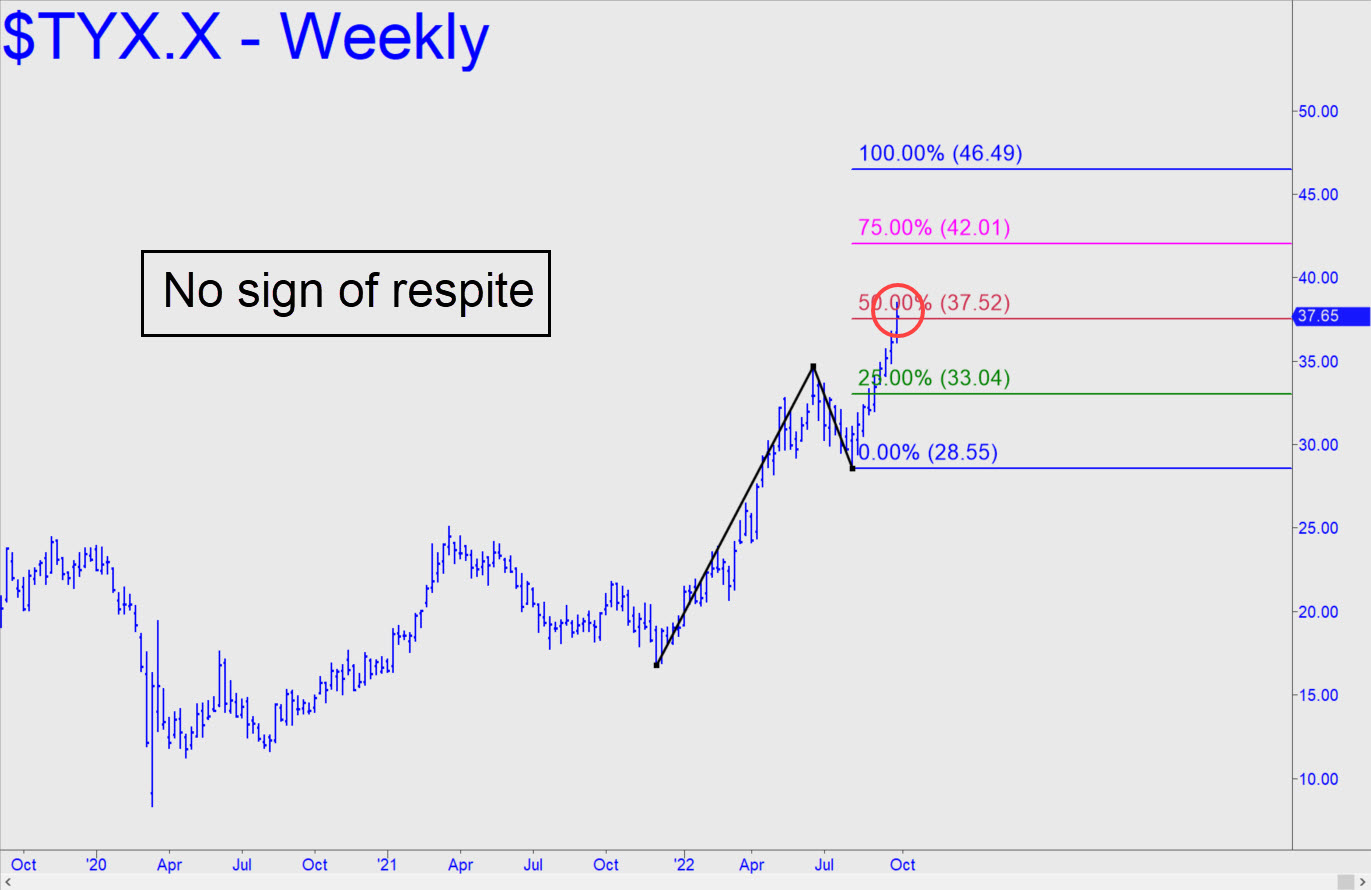
 Last week’s decisive breach of a midpoint support at 103.59 on the weekly chart implies that bulls have yet more pain to endure. TLT looks primed to fall all the way to D=86.48. The odds of this shortened when the breach was followed by a Friday close beneath the ‘p’ Hidden Pivot support. The abysmal target is congruent with my 4.9% forecast for rates on the 10-Year, which ended the week at 3.8%. A rally to the green line (112.14) might be seen by some as a hopeful sign, but from a Hidden Pivot perspective it would be a great opportunity to get short ‘mechanically, stop 120.70. (Note: I am not featuring the 30-Year here because it has inverted relative to the 10-Year.)
TLT – Lehman Bond ETF (Last:102.45)
Posted on October 2, 2022, 5:13 pm EDT
Last Updated September 30, 2022, 9:20 pm EDT