
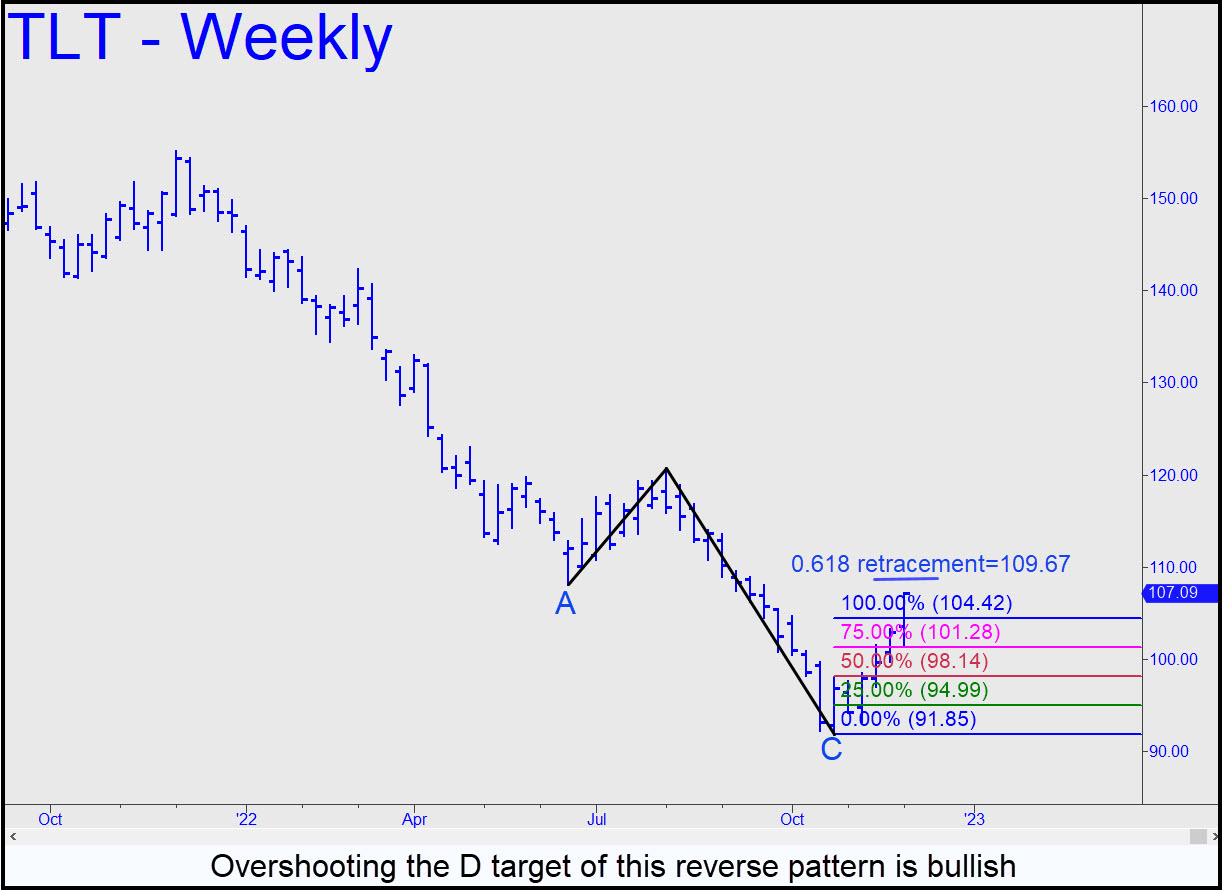
 The bull trend begun in late October showed signs of getting legs when it closed above the 104.42 D target of the reverse pattern shown. There are no immediate external peaks nearby that we could use to gauge the rally’s strength, but we’ll continue to monitor its temperature nonetheless using other benchmarks such as the 0.618 Fibonacci retracement level that would equate to a price of 109.67. An easy move through it would signify that buying power has not abated as the rally has progressed. ______ UPDATE (Dec 8, 9:27 p.m.): TLT has pulled back only slightly after topping on Wednesday a penny above the 109.67 Fibo line we were using as a minimum upside objective. It looks like it wants to run higher, but let’s wait and see.
TLT – Lehman Bond ETF (Last:109.17)
Posted on December 4, 2022, 5:09 pm EST
Last Updated December 8, 2022, 9:28 pm EST