
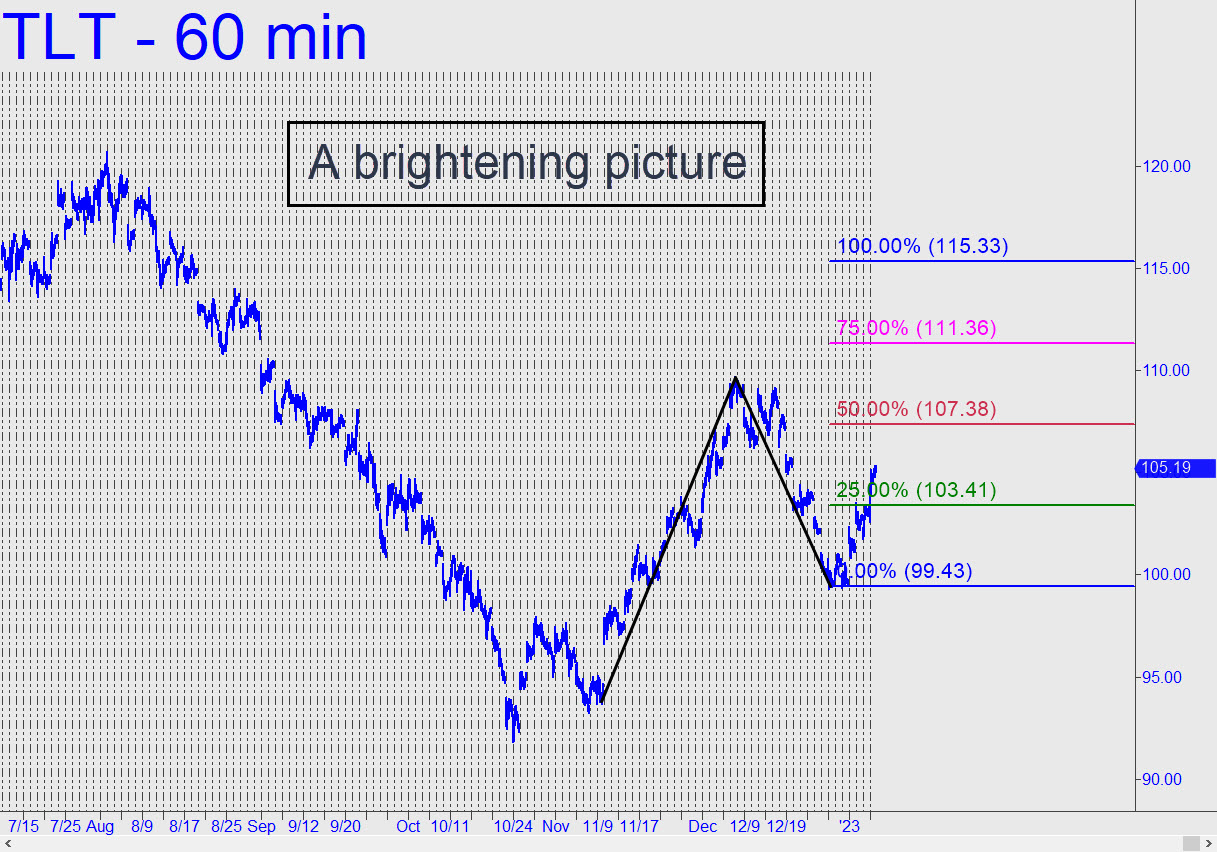
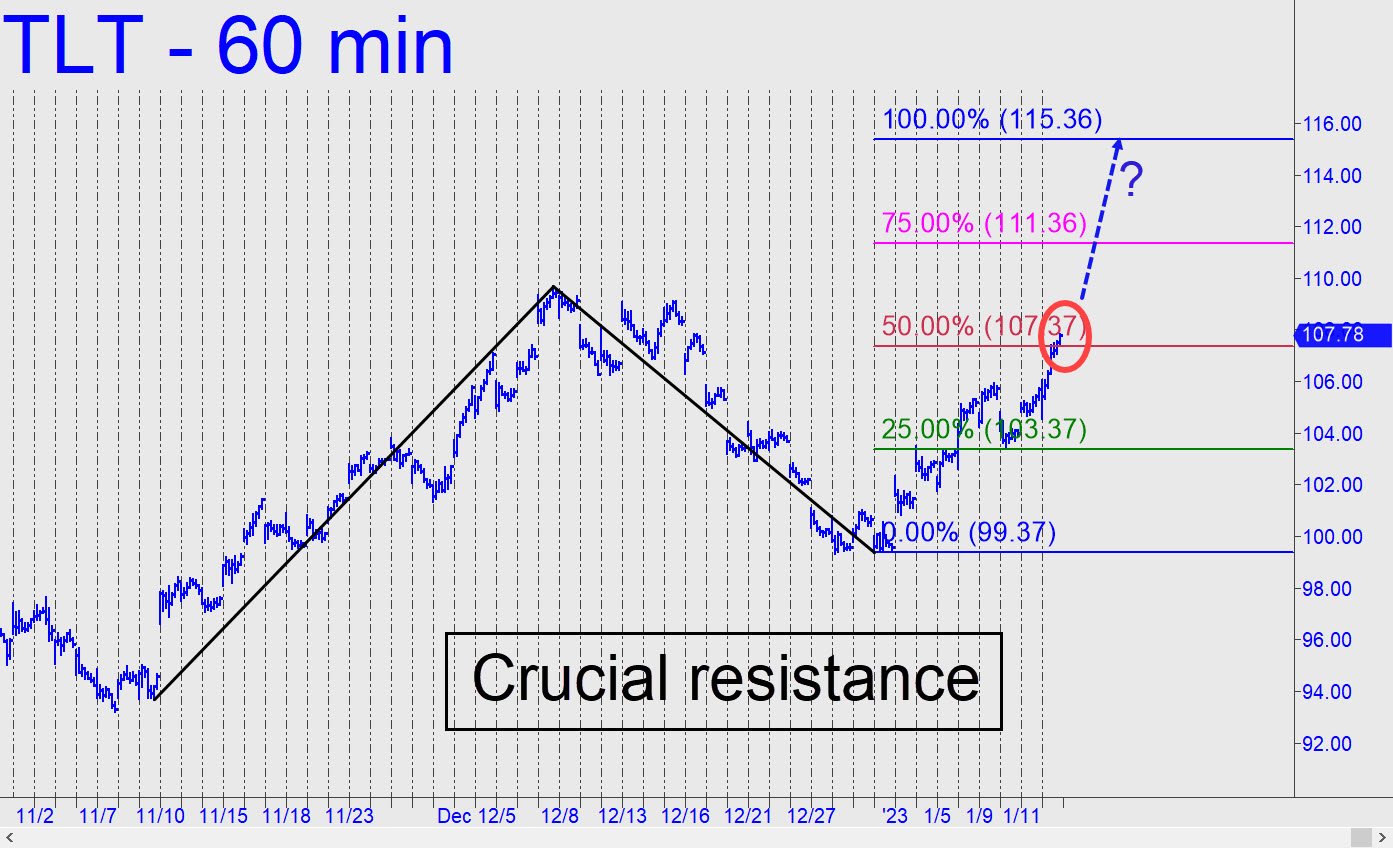
 Skepticism toward the rally begun in November blurred my vision for a while, but last week’s sunburst turned the intermediate-term picture too bright to ignore. It tripped a conventional buy signal at the green line with sufficient brio to suggest a further run-up to at least p=107.38, or even D=115.33. It is the interaction between buyers and those Hidden Pivot resistances that can tell us whether the rally is just getting warmed up — i.e., whether the brutal bear market begun in March 2020 is finally over. Stay tuned, because I will be tracking this chart more diligently in the weeks ahead. ______ UPDATE (Jan 12, 6:45 p.m.): A strong, three-day rally has stalled almost precisely at the crucial, 107.38 midpoint Hidden Pivot resistance flagged above. As always, a decisive move past it would portend more upside to the (slightly adjusted) D target at 115.36.
TLT – Lehman Bond ETF (Last:107.78)
Posted on January 8, 2023, 5:22 pm EST
Last Updated January 12, 2023, 9:26 pm EST
- January 9, 2023, 1:36 am
very much agree, TY