
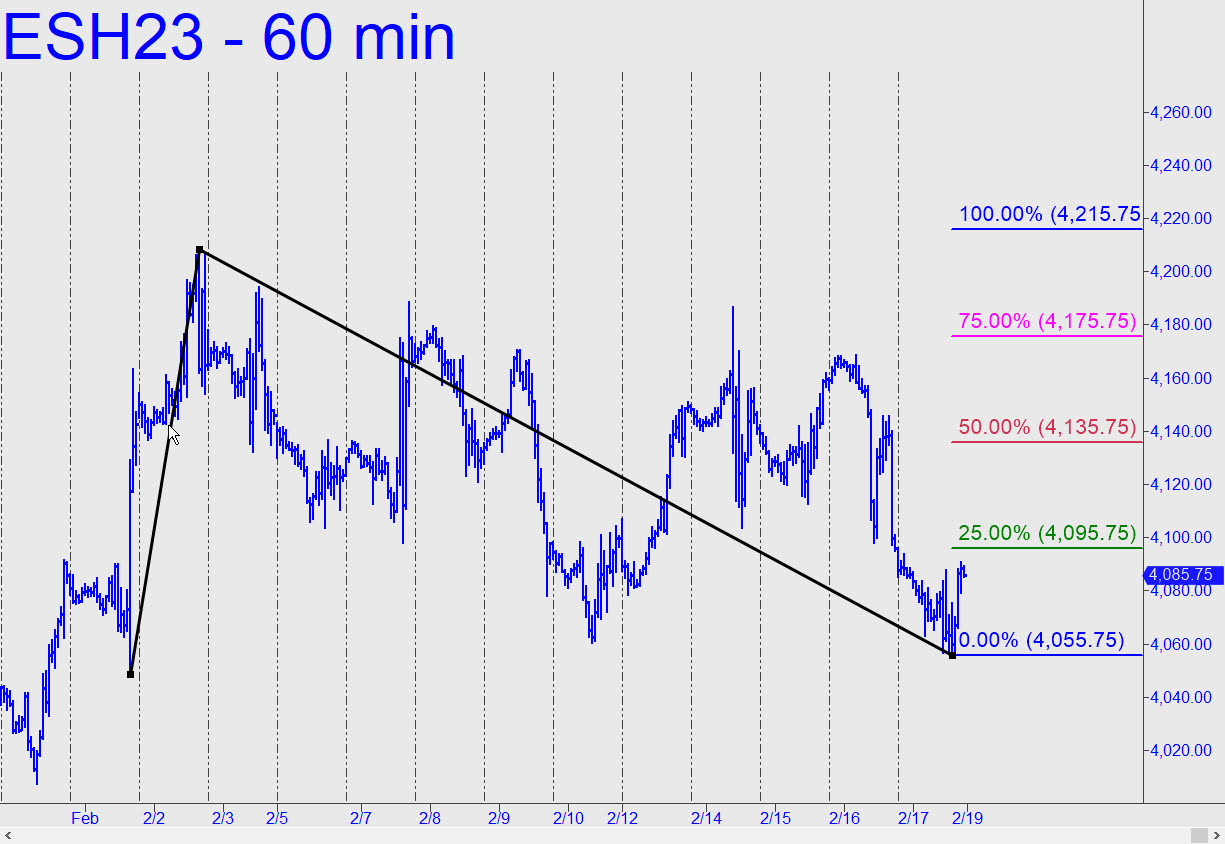
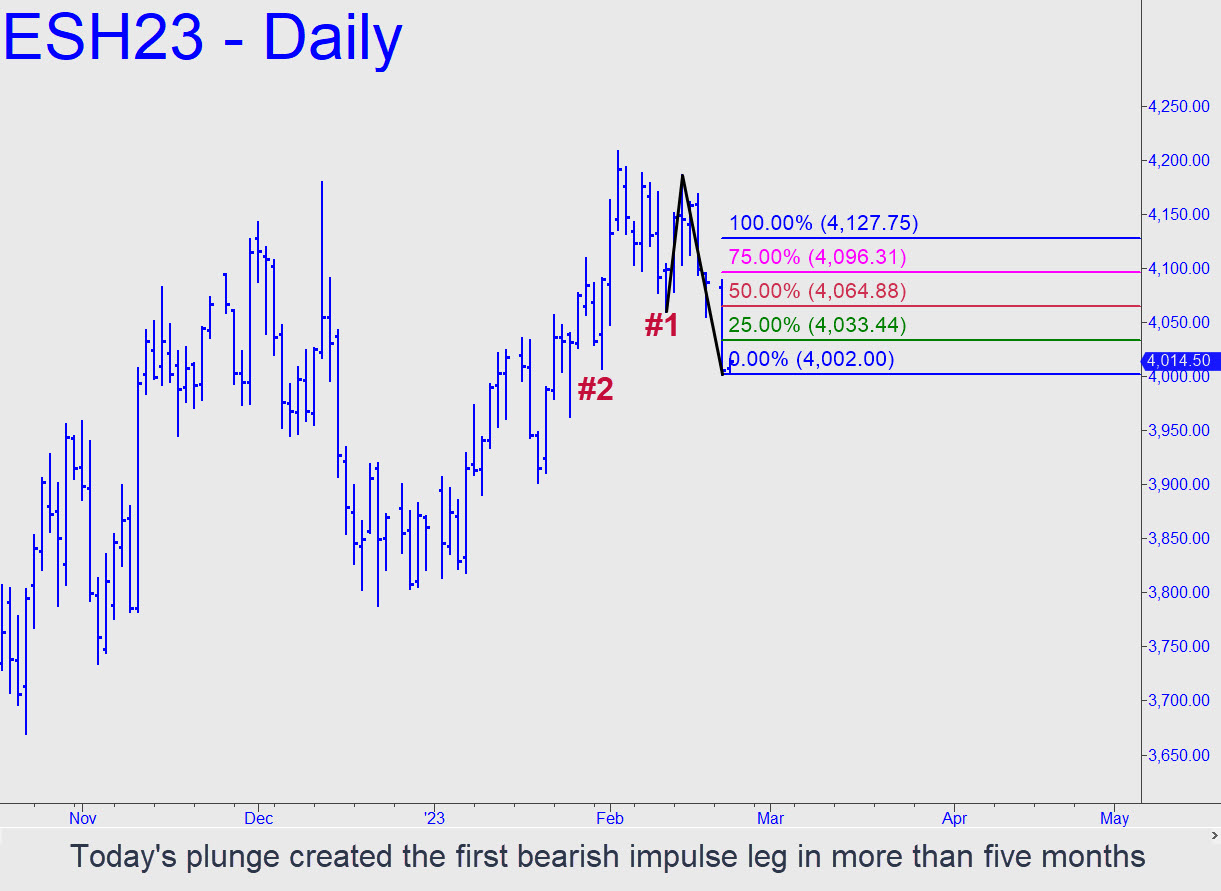
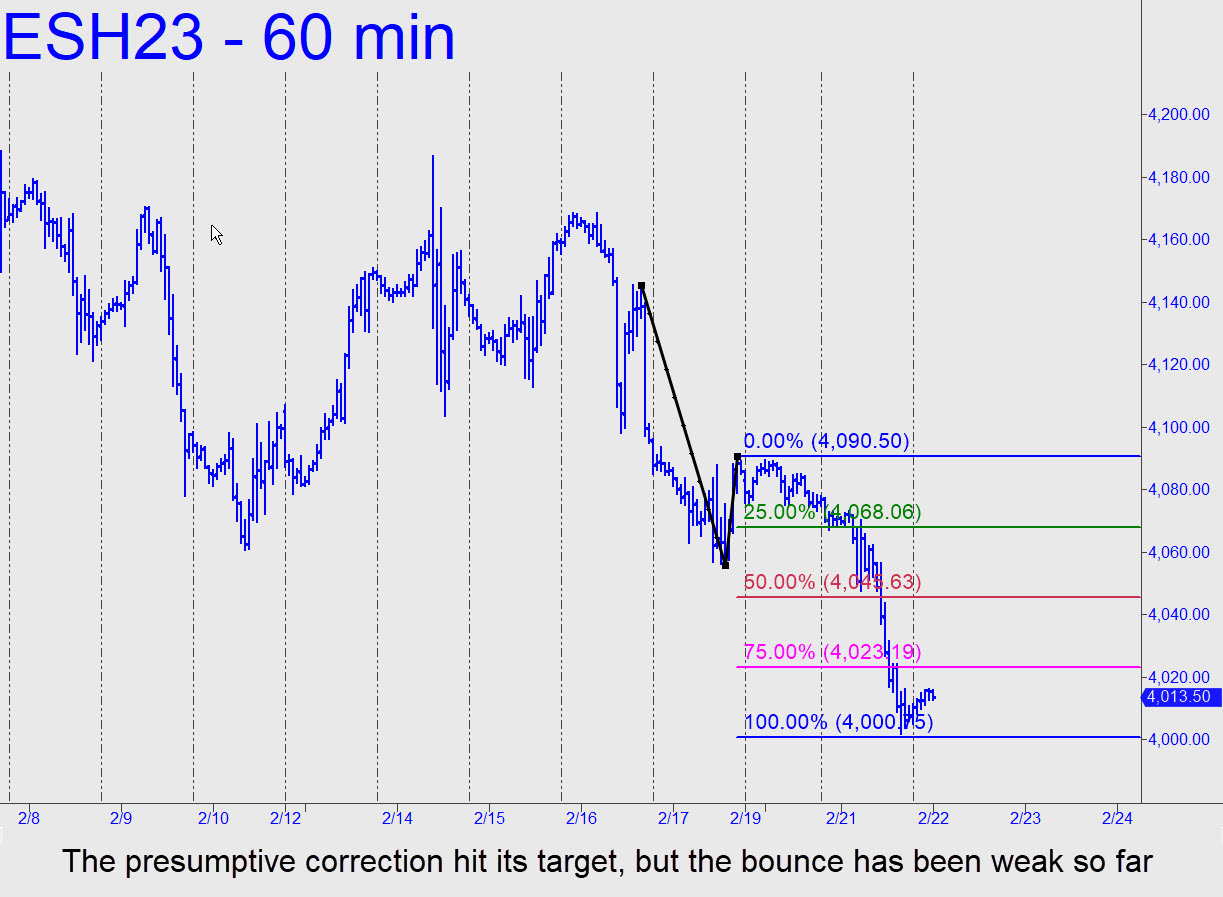
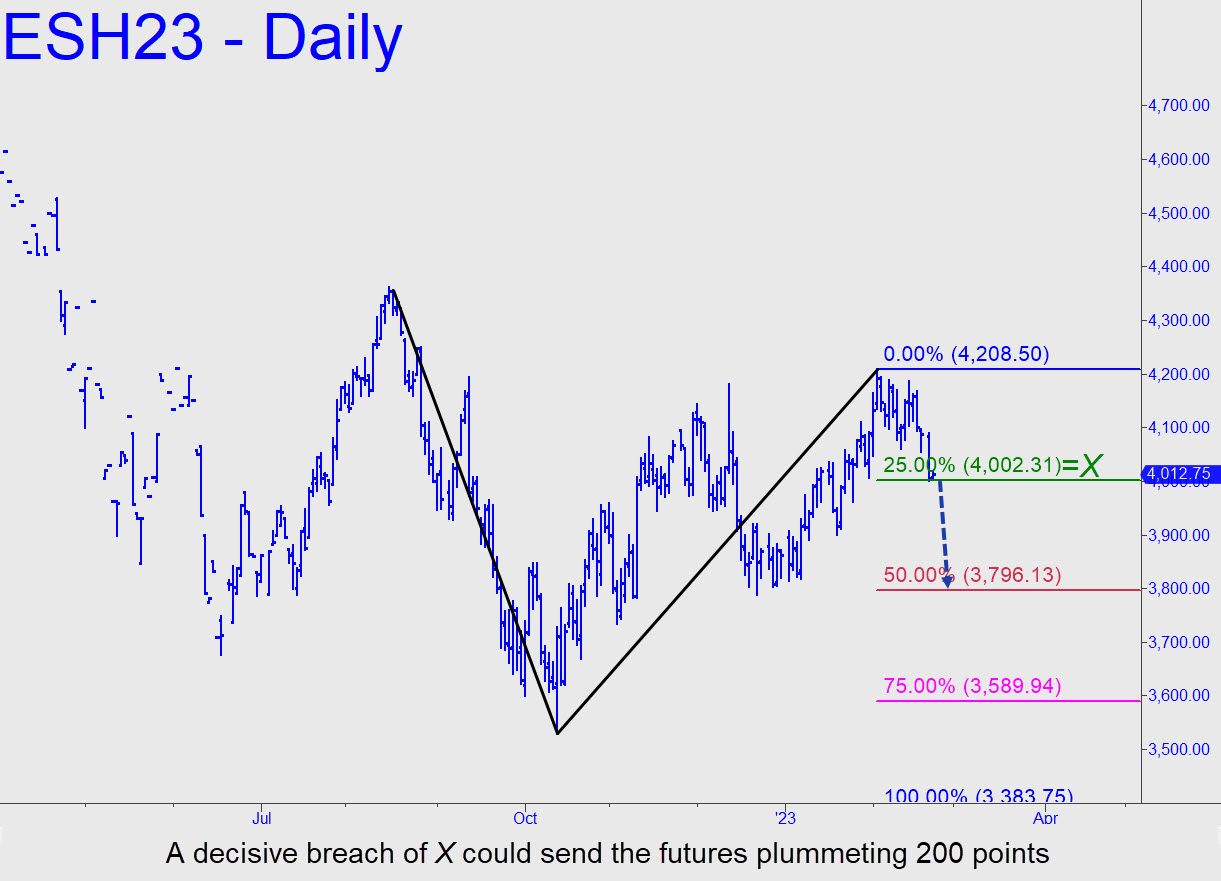
 Let’s start the week with modest expectations, since the March contract spent the last three weeks screwing the pooch. That’s not bad, actually, considering the cascade of dispiriting earnings announcements over that period. The pattern shown projects a run-up of as much as 130 points over the near term to a 4215.75 target, assuming the futures are ready to ditch the doldrums. The ABCD is a little too obvious to deliver swing highs and lows that are as reliable and precise as we’re used to, but it will probably support a favorable ‘mechanical’ buy if there’s a pullback to the green line from above p=4135.75. ______ UPDATE (Feb 22, 12:16 p.m.): Today’s plunge following a three-day weekend generated the first bearish impulse leg we’ve seen on the daily chart in more than five months. I have drawn a bullish ‘reverse’ pattern nevertheless because the intraday low occurred precisely at the ‘D’ target of a presumptive abcd correction. The recovering bounce has been feeble so far, and that’s a point in bears’ favor at the moment. However, that could change overnight, and if the futures do in fact continue their bounce, nearly any reverse pattern you could draw to trigger a bull trade would be a good bet to return a profit. Alternatively, if the March contract relapses and closes for two consecutive days beneath the 4002.00 intraday low, a fall to at least p=3796.00 would become no worse than an even bet. A slight overshoot of that midpoint Hidden Pivot support could generate a quite powerful impulse leg if there are no significant upward retracements en route, lending weight to speculation that papa bear has returned with a vengeance.
ESH23 – March E-Mini S&Ps (Last:4013.50)
Posted on February 19, 2023, 5:20 pm EST
Last Updated February 24, 2023, 10:29 am EST