
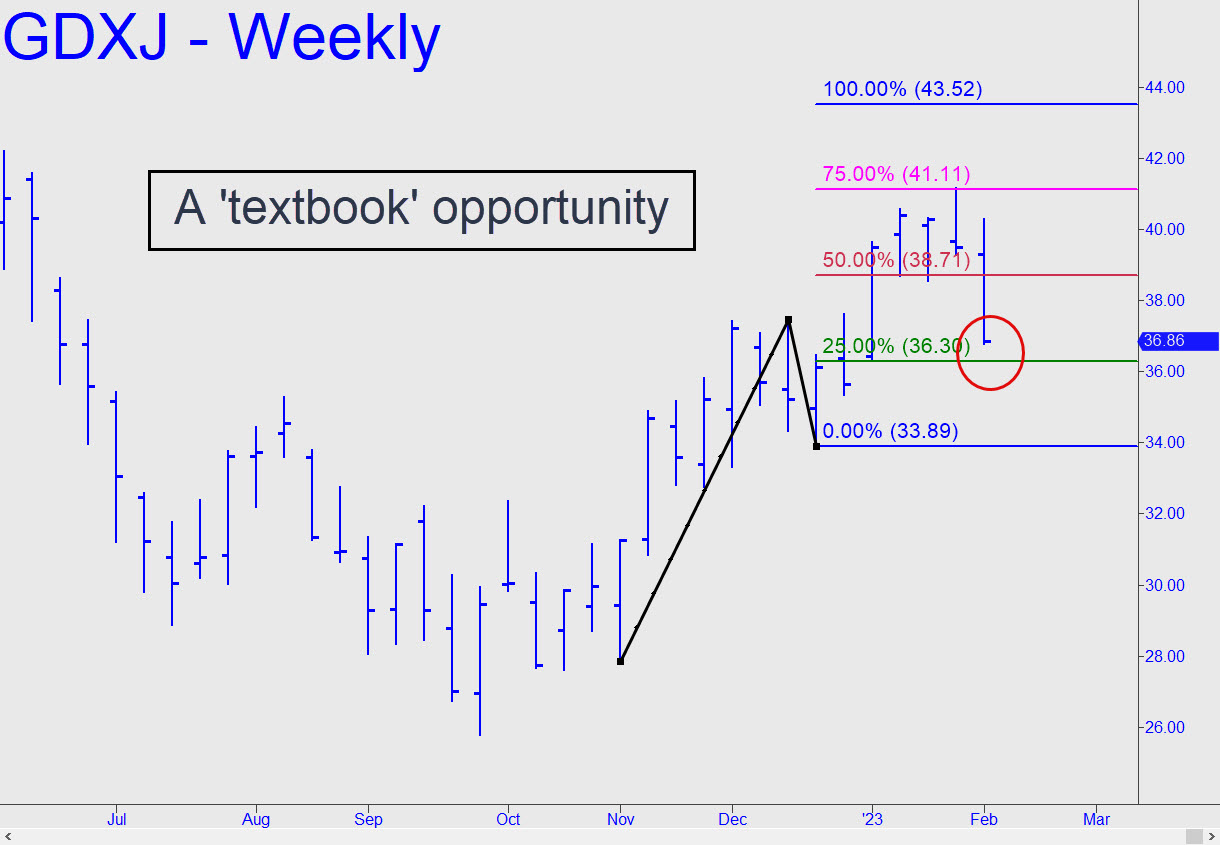
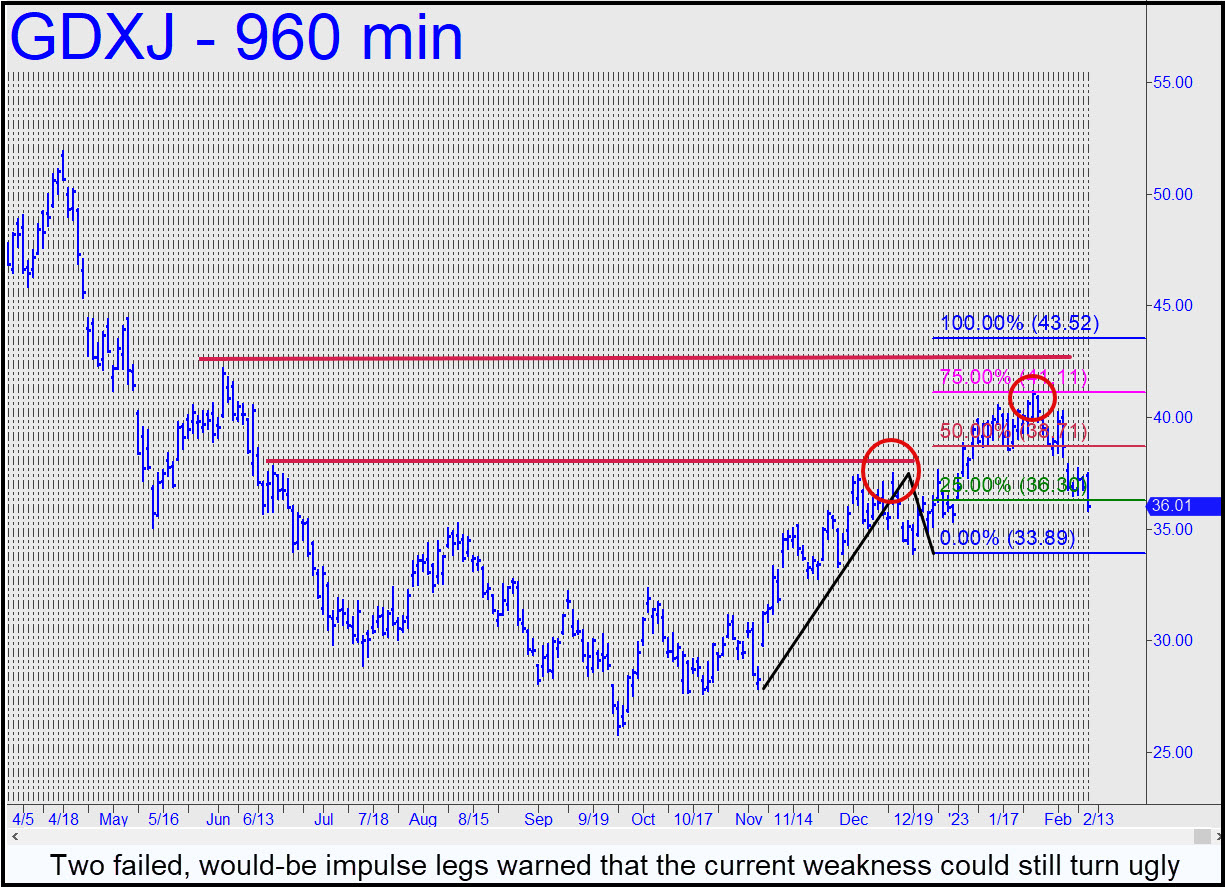
 Last week’s hellish dive has brought GDXJ within easy distance of the green line (x=36.30) where I’d suggested bottom-fishing. Like many of the best ‘mechanical’ trades, this one should have you feeling queasy in the wake of such a determined selloff. This pattern implies it will be short-lived, since there is no mistaking its attractiveness. A stop-loss at 33.88, just below ‘C’, would risk nearly $1,000 on four round lots, but we’ll look to cut that down to size with ‘camouflage’ when GDXJ triggers the trade by touching x. If you’re interested, stay close to the chat room discussion when it gets closer. ______ UPDATE (Feb 9, 4:15 p.m.): The scary trade is now ‘live’, at least in theory. However, because a few minor supports have been stopped out, I’d suggest paper-trading this one. If the trade doesn’t work, I would infer it’s because the point ‘B’ high of the relevant pattern was not impulsive — i.e., it narrowly failed to surpass the June 16 ‘external’ peak at 37.81. In addition, the subsequent C-D leg failed at p2=41.11, well shy of another important ‘external’ peak at 42.19. All of this is shown in this chart.
GDXJ – Junior Gold Miner ETF (Last:36.01)
Posted on February 5, 2023, 5:15 pm EST
Last Updated February 9, 2023, 5:11 pm EST