
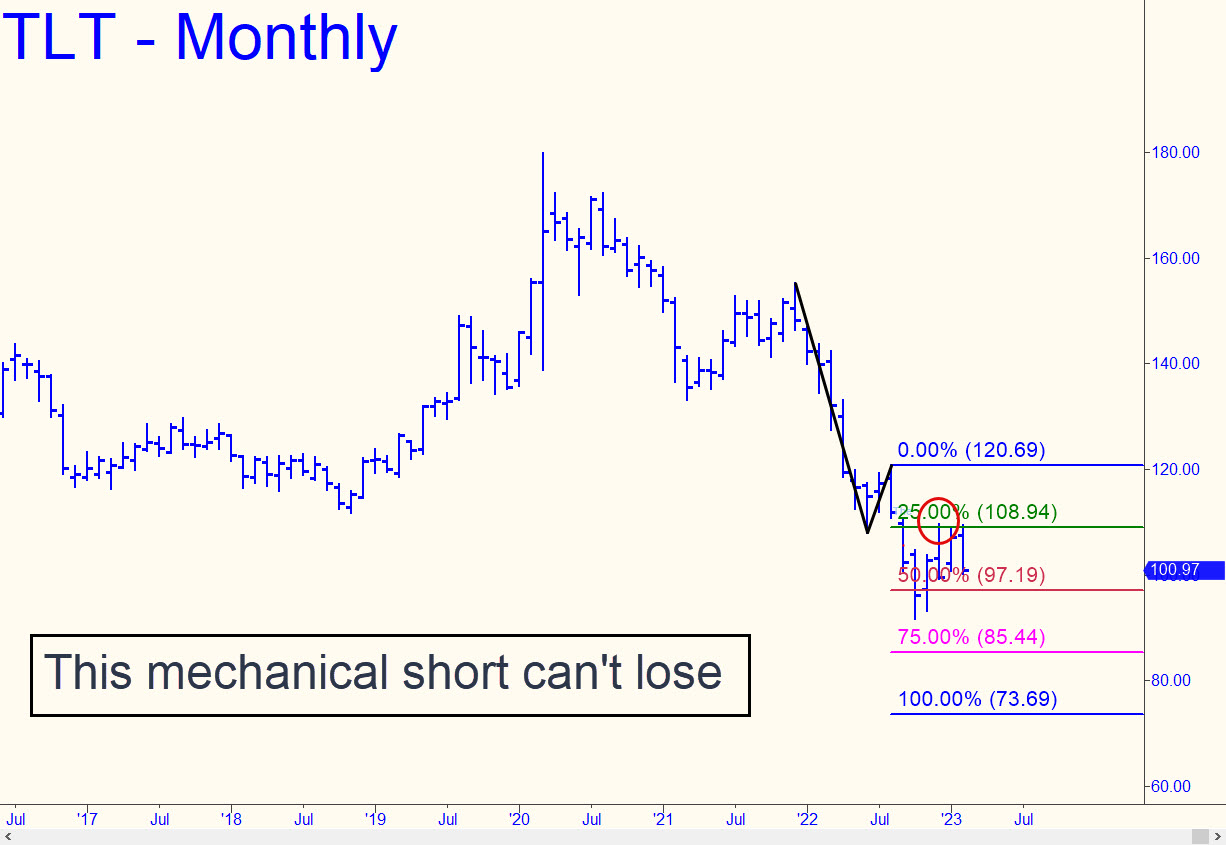
 A monthly chart stretching back nearly 20 years shows the devastation that has occurred in long-term Treasurys since they spiked to 179 as pandemic fears took hold in March 2021. If TLT is ultimately on its way down to D=73.69, it’s hard to imagine what the economic landscape would look like at that point; however, it certainly would not be in the ruinous state of deflation that I’ve long predicted. More immediately, TLT signaled a textbook ‘mechanical’ short at x=108.84 that is all but certain to hit p=97.19 on the relapse. An easy move through this Hidden Pivot would leave it on track for a further fall to p2=85.44.
TLT – Lehman Bond ETF (Last:100.97)
Posted on February 26, 2023, 5:21 pm EST
Last Updated February 26, 2023, 6:13 pm EST