
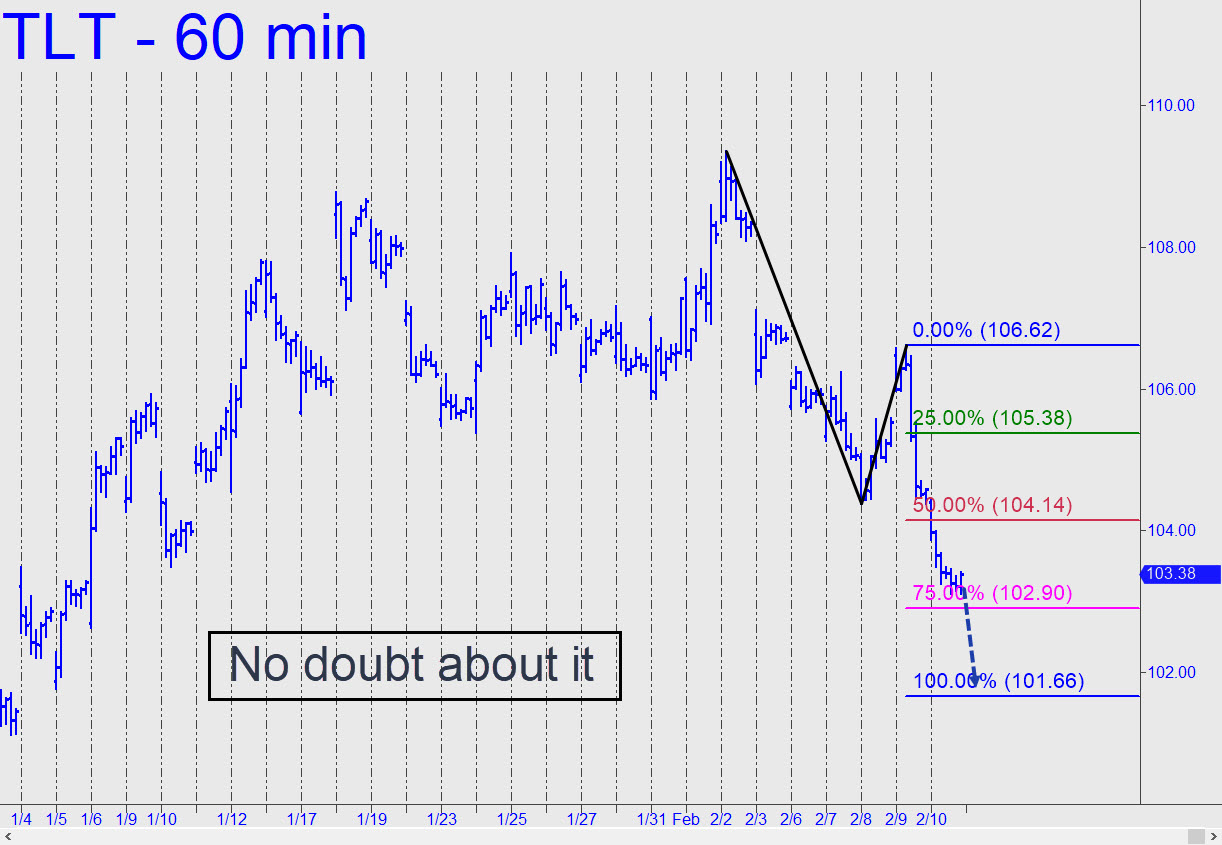
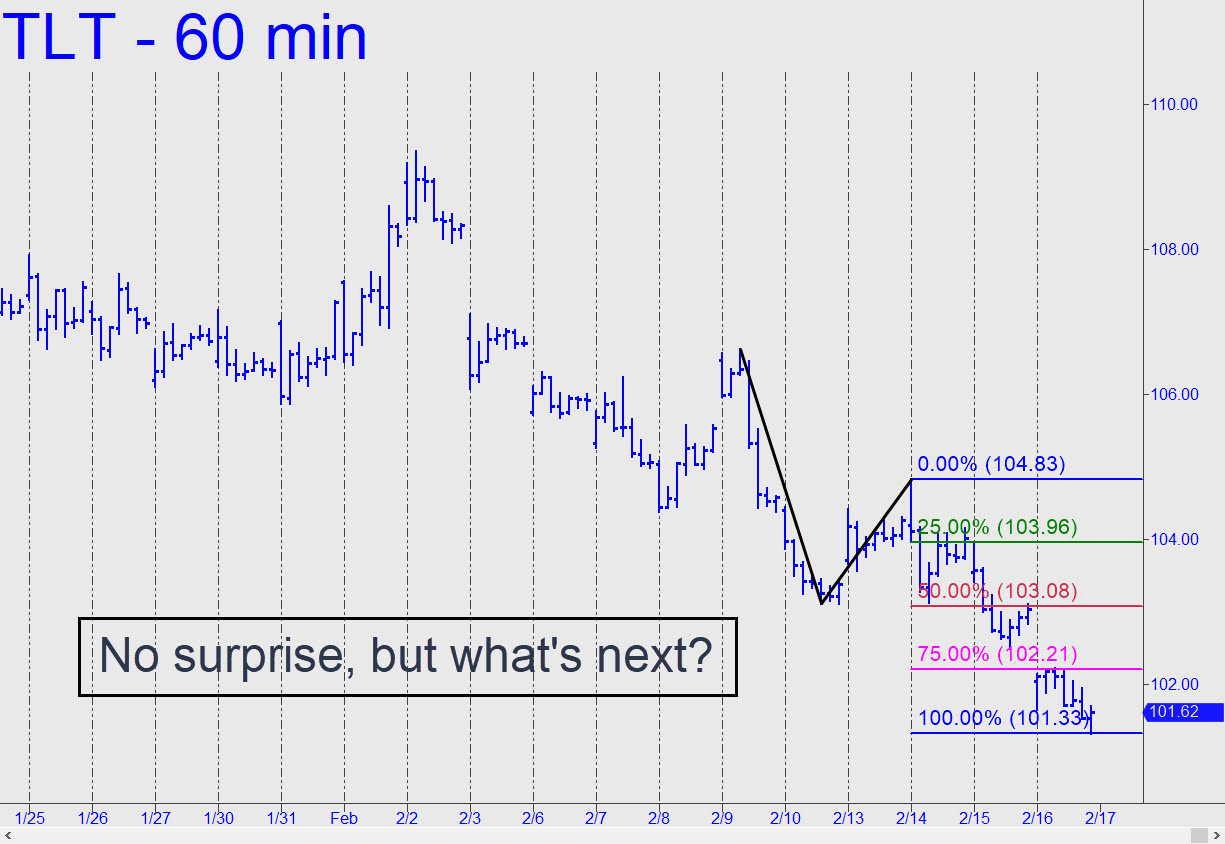
 TLT took a $2.20 bounce from with six cents of the 104.45 target flagged here for bottom-fishing, but the rally was short-lived. The relapse has further to go and looks likely to achieve the 101.66 downside ‘D’ target shown in the chart (inset). A pause at p2=102.90 could occur, but the way sellers crushed the 104.14 midpoint support, the respite is unlikely to be tradeable. Bottom-fishing precisely at 101.66 doesn’t look promising either, since the herd will be nervously focused on the nearby low at 101.78 recorded on Jan 5. ______ UPDATE (Feb 16, 8:26 p.m.): A minor Hidden Pivot support at 101.33 has precisely contained the latest plunge of this sack of lug nuts, but it remains to be seen whether it has terminated it.
TLT – Lehman Bond ETF (Last:101.62)
Posted on February 12, 2023, 5:17 pm EST
Last Updated February 16, 2023, 8:26 pm EST