
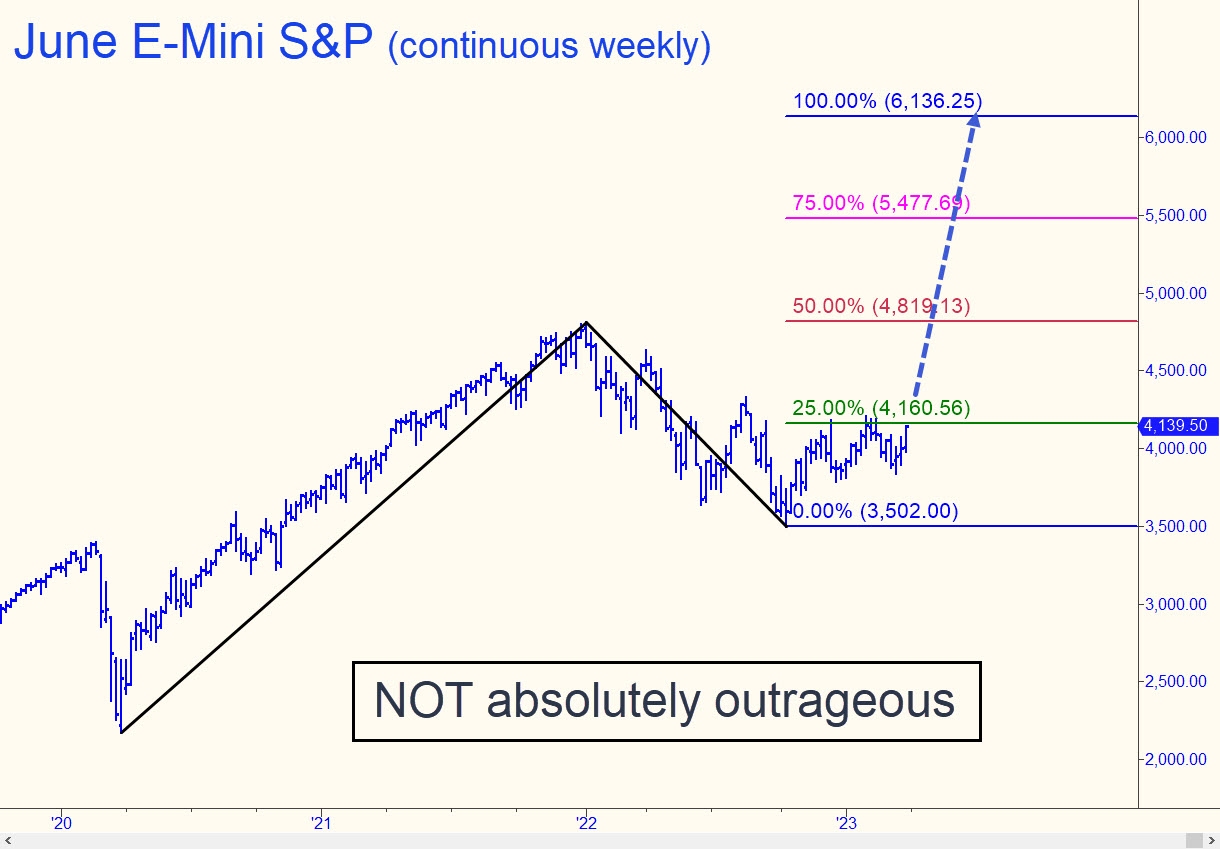
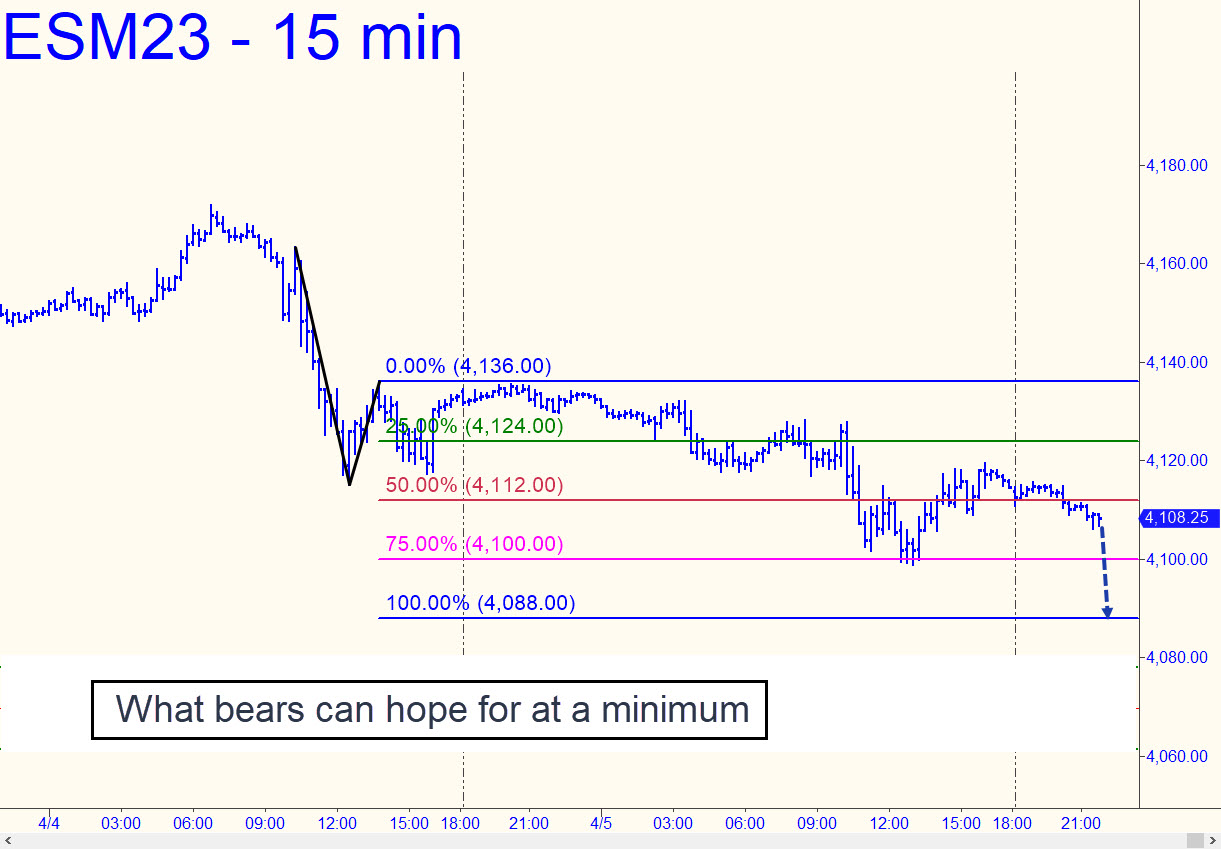
 When a subscriber posted another guru’s 6000 target for the S&Ps, my first thought was, oh great, how does an honest forecaster compete with a publicity seeker who billboards such an outrageously bullish target? But when I replicated the guy’s chart pattern, I was forced to conclude that a moon shot to 6000 would not be so outrageous after all. A corresponding Hidden Pivot target lies at 6136, a less-than-exact number because I’ve used a composite chart to calculate it. A theoretical rally to 6136 has already been signaled by two feints above the green line since December. The line is about to be head-butted for a third time, and probably surpassed. If the June futures were to pop through it this time and then push above last August’s peak at 4327 (which is likely if ESM23 closes for two weekly bars above X=4160), I’d infer that a test of p=4819 is no worse than an odds-on bet. That would be equal to the all-time high at 4800 recorded on January 4, 2022, and, probably, a launching pad for a blowoff to 6136. _____ UPDATE (Apr 4, 7:52 p.m. EDT): The futures came down hard after hitting the 4171.50 rally target of a textbook-obvious pattern that had been widely promoted in the trading world. Some saw it as the beginning of a landslide, and that would certainly be nice. But cooler heads will have an opportunity to prevail tomorrow, so permabears shouldn’t get their hopes too high. _______ UPDATE (Apr 5, 9:50 p.m.): Bears can count on a fall to at least D=4088.00, but if this Hidden Pivot support fails, expect more slippage to 4070 or lower. Here’s the chart.
ESM23 – Jun E-Mini S&P (Last:4108)
Posted on April 2, 2023, 5:20 pm EDT
Last Updated April 6, 2023, 8:56 am EDT