
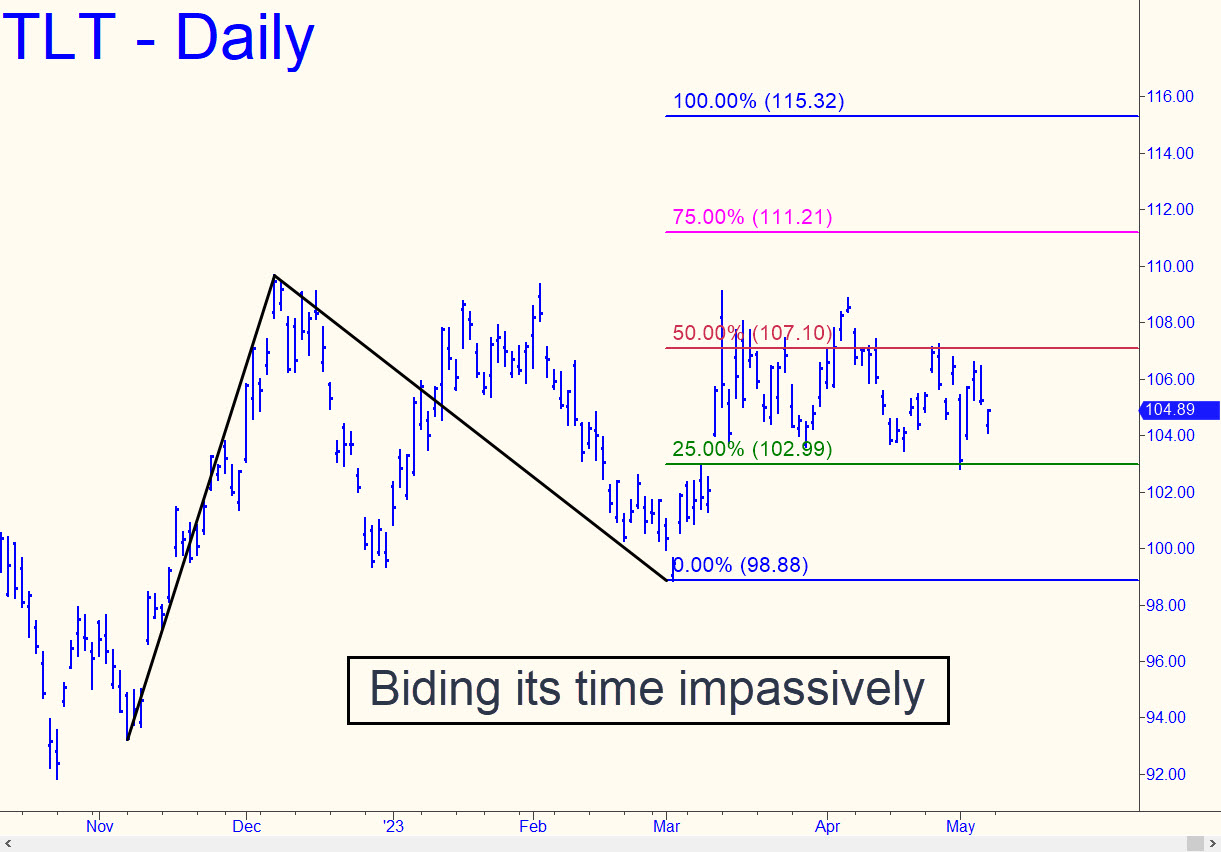
 TLT has been biding its time since last December, trapped in a tedious range until it’s ready to break out for a shot at the 115.32 target shown. Last week’s dip to the green line triggered the first ‘mechanical’ buy signal we’ve seen on the daily chart this year. It would take a feint to the downside exceeding C=98.88 to stop out the trade. My hunch is that the next time buyers revisit the red line, a midpoint Hidden Pivot resistance, they will mean business.
TLT – Lehman Bond ETF (Last:104.89)
Posted on May 7, 2023, 5:16 pm EDT
Last Updated May 5, 2023, 5:51 pm EDT