
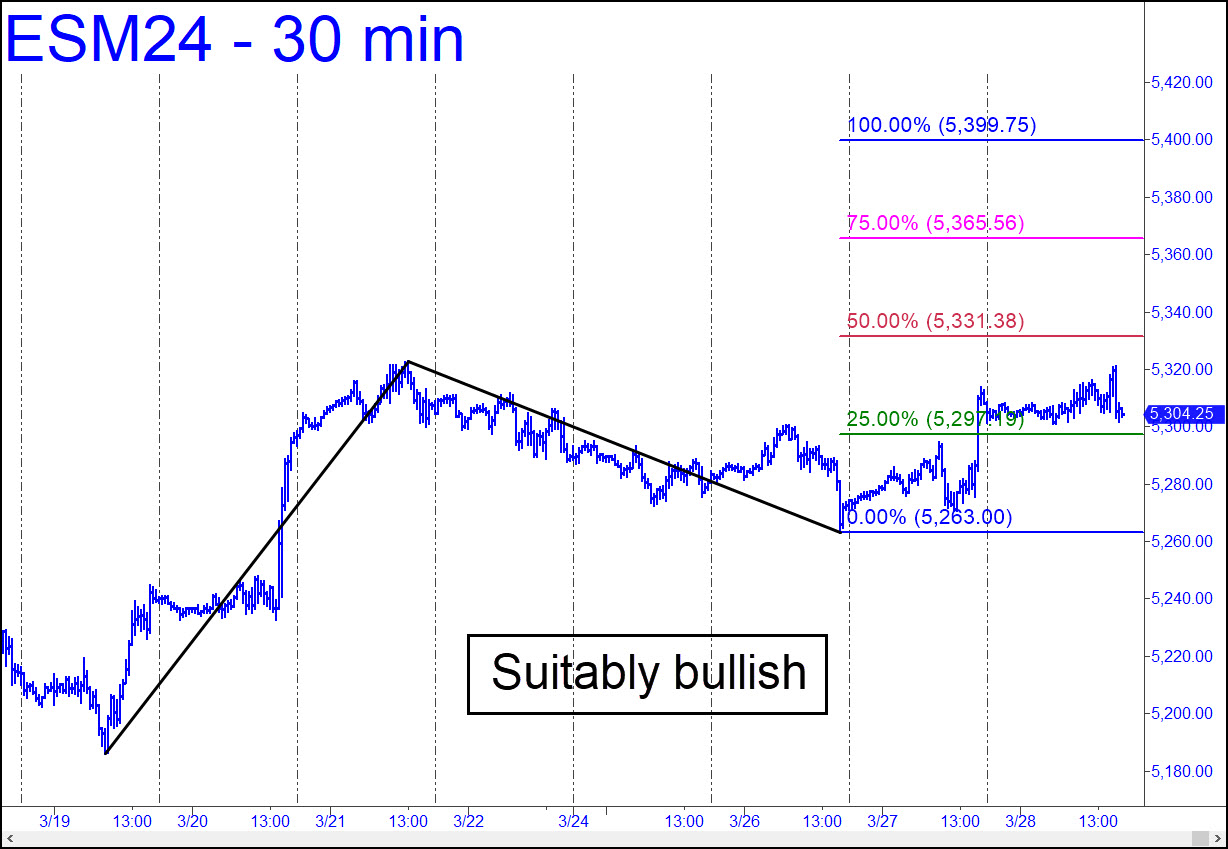
 There are no fewer than four bullish patterns at work in the chart shown, so I’ve settled on the one with the most ambitious rally target. It lies at 5399.75, and it is jumping the gun to assure you the futures will get there before they have even touched the midpoint Hidden Pivot (p=5331.38), it seems safe to assume that bulls are not likely to be thwarted. A moment’s pause could be fatal to the psychotic energy that has impelled the broad averages heedlessly higher, even as ‘bubble’ warnings have begun to pop up even in the WSJ and at Bloomberg.com. As always, the ease with which buyers penetrate p the first time they encounter it will tell us all we need to know about trend strength. _______ UPDATE (April 2, 9:38 a.m.): Here’s something we’ve seen only very rarely in the last 15 years, and not at all during the psychotic, suck-everyone-in phase of the bull market begun last October: a bullish pattern that aborted without having reached p, never mind D. The implications are of course bearish, at least for the near term. I take them seriously because MSFT never got more than a few pennies above the 430.58 high I’ve been saying since last January would mark the end of the bull market. We shall see.
ESM24 – June E-Mini S&Ps (Last:5246.00)
Posted on March 31, 2024, 5:20 pm EDT
Last Updated April 2, 2024, 9:38 am EDT