
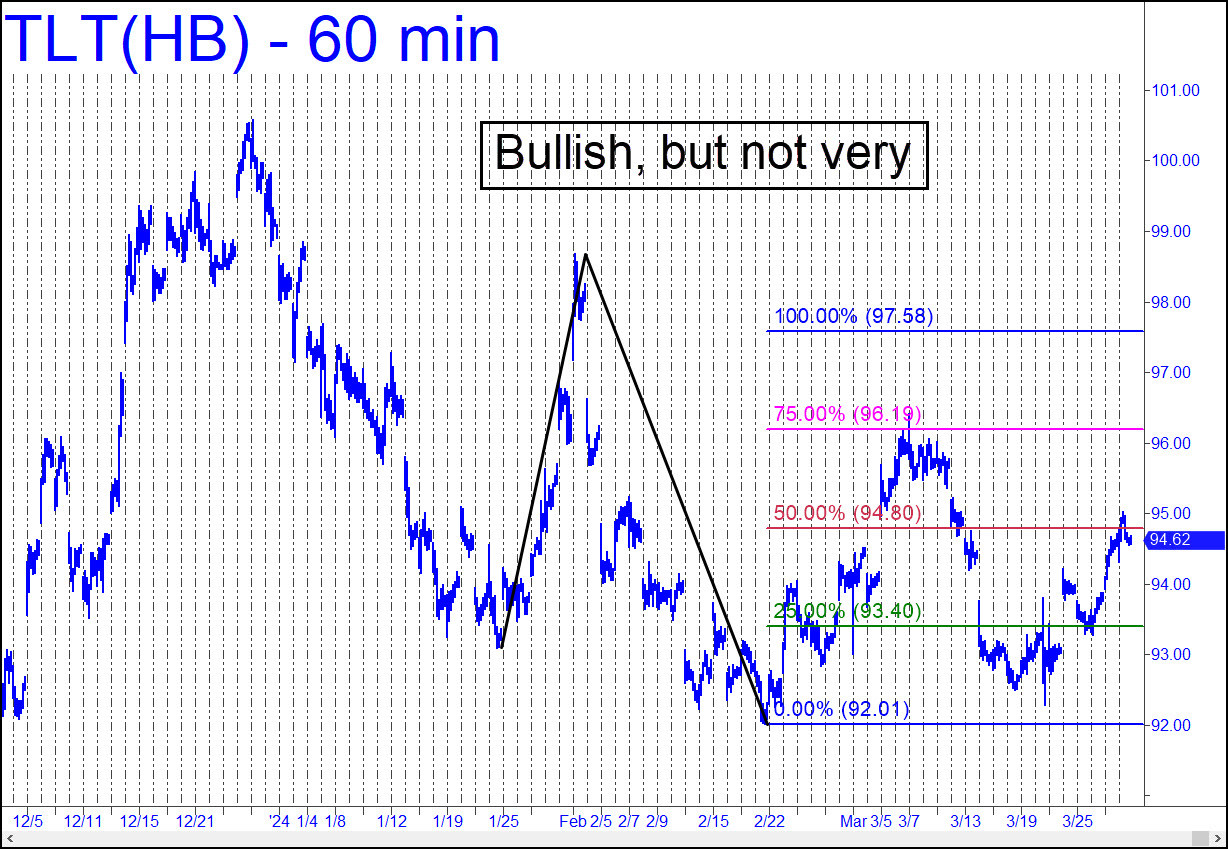
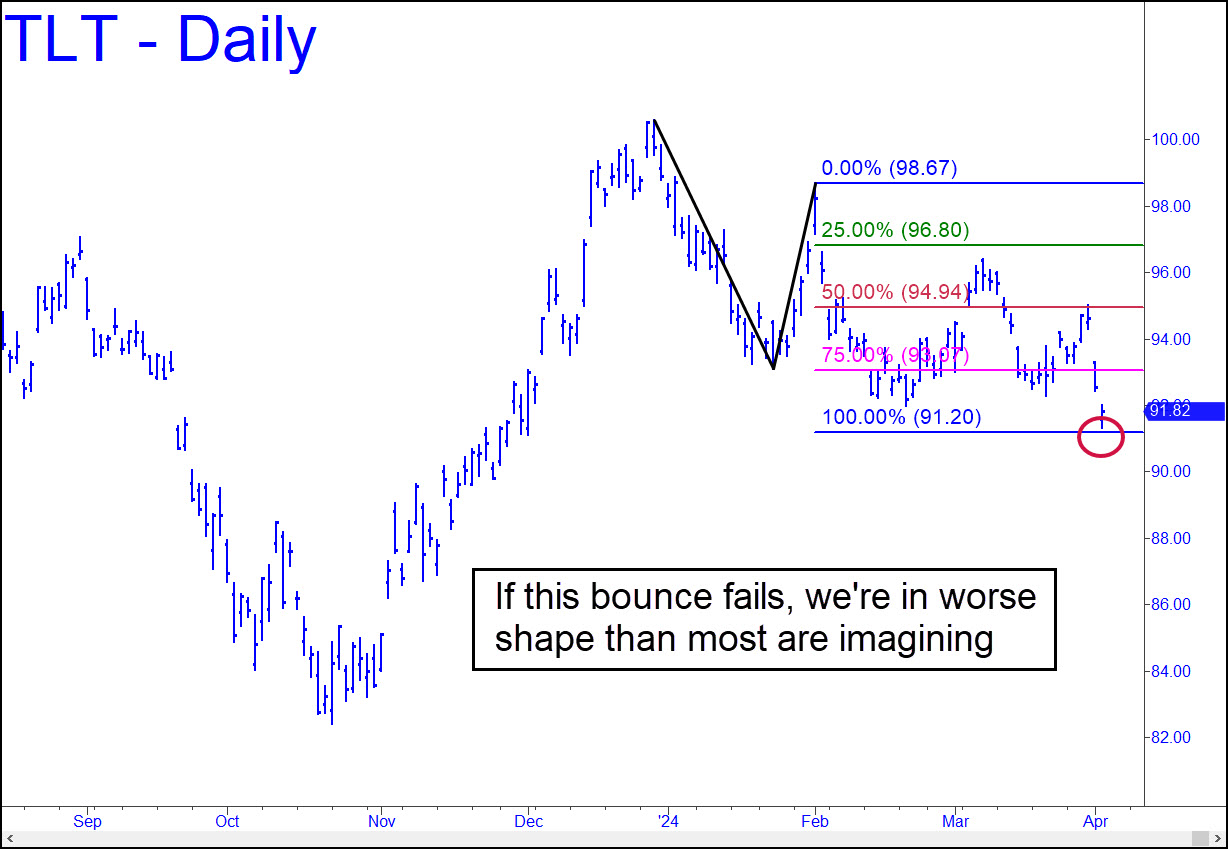
 The ‘mechanical’ trade that triggered three weeks ago with a drop to x=93.40 has survived a brush with death that saw it fall to within an inch of being stopped out below C=92.01 of the pattern shown. Since then, TLT has achieved a solid gain following a theoretical ‘mechanical’ entry at the green line. A further run-up to D=97.58 looks like no worse than an even bet at this point, but we’ll wait to see more price action at the red line before we attempt to winnow down the odds. Should I keep this symbol on the core list? WordPress failed to publish the TLT tout I’d prepared last week, but no one noticed it, including me. ______ UPDATE (Apr 2, 10:52 a.m.): Two huge gaps to start the week have put TLT in a freefall. This morning’s moderate bounce has come from within a hair of a crucial Hidden Pivot target at 91.20, but if it fails, look out below!
TLT – Lehman Bond ETF (Last:91.94)
Posted on March 31, 2024, 5:12 pm EDT
Last Updated April 2, 2024, 10:49 am EDT