
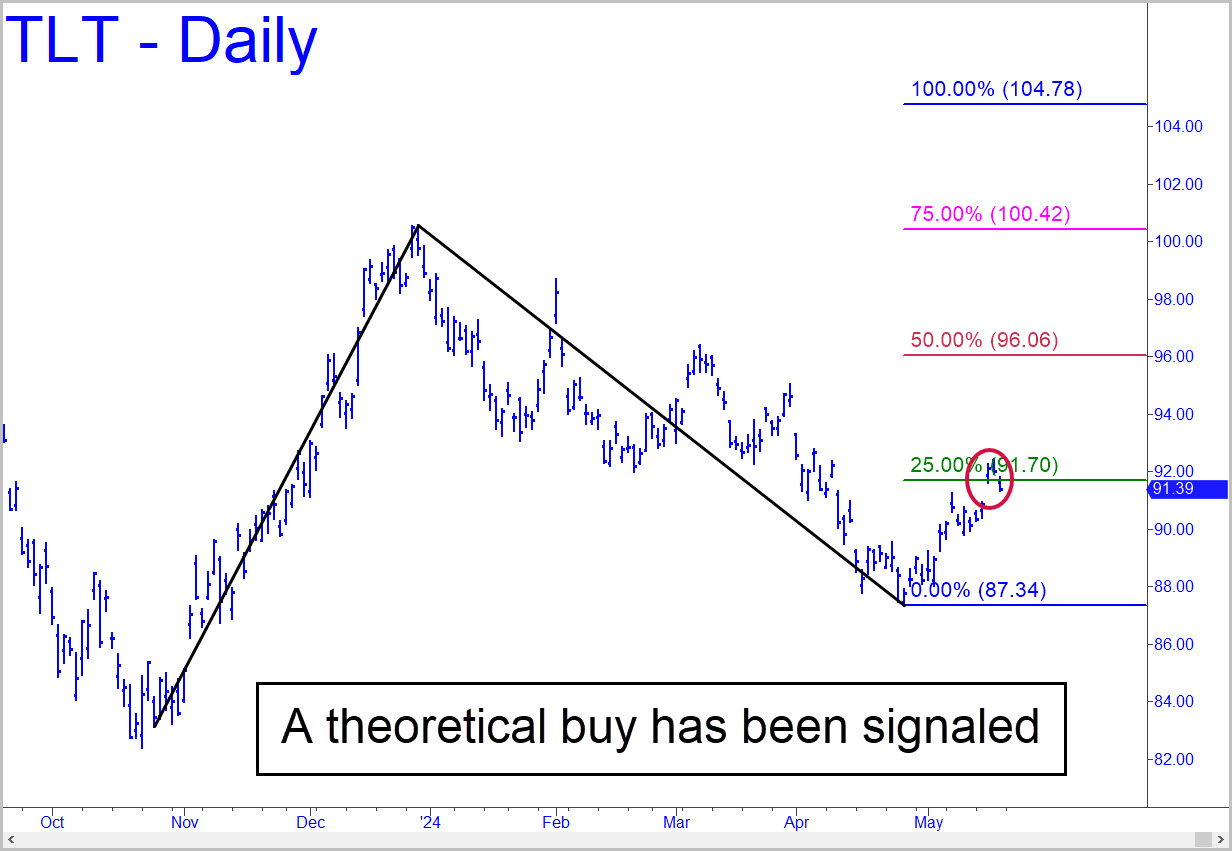
 The gap opening above the green line last Wednesday triggered a theoretical ‘buy’ signal on the daily chart. It was the third such signal this year, but because it is coming from a lower corrective low, odds are better that the low, 87.34 (4/25), will endure. Adding to the incipiently bullish picture, the week’s summit exceeded the highest ‘d’ target that could have been projected using an rABC pattern on this chart. It’s a long way to p=96.06, where price action could help us handicap the odds of D=104.78 being reached, but that Hidden Pivot target can serve as our minimum upside objective for now
TLT – Lehman Bond ETF (Last:91.39)
Posted on May 19, 2024, 5:21 pm EDT
Last Updated May 18, 2024, 2:16 pm EDT