
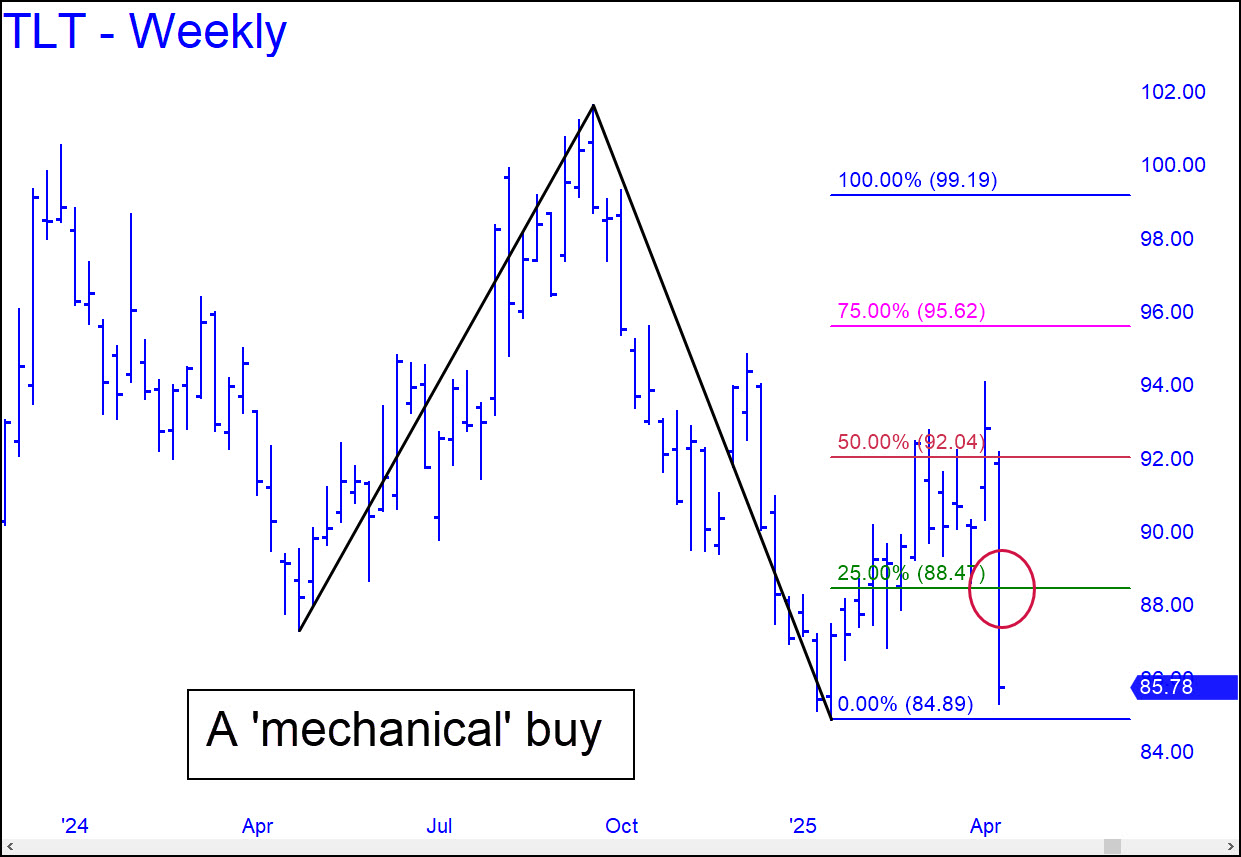
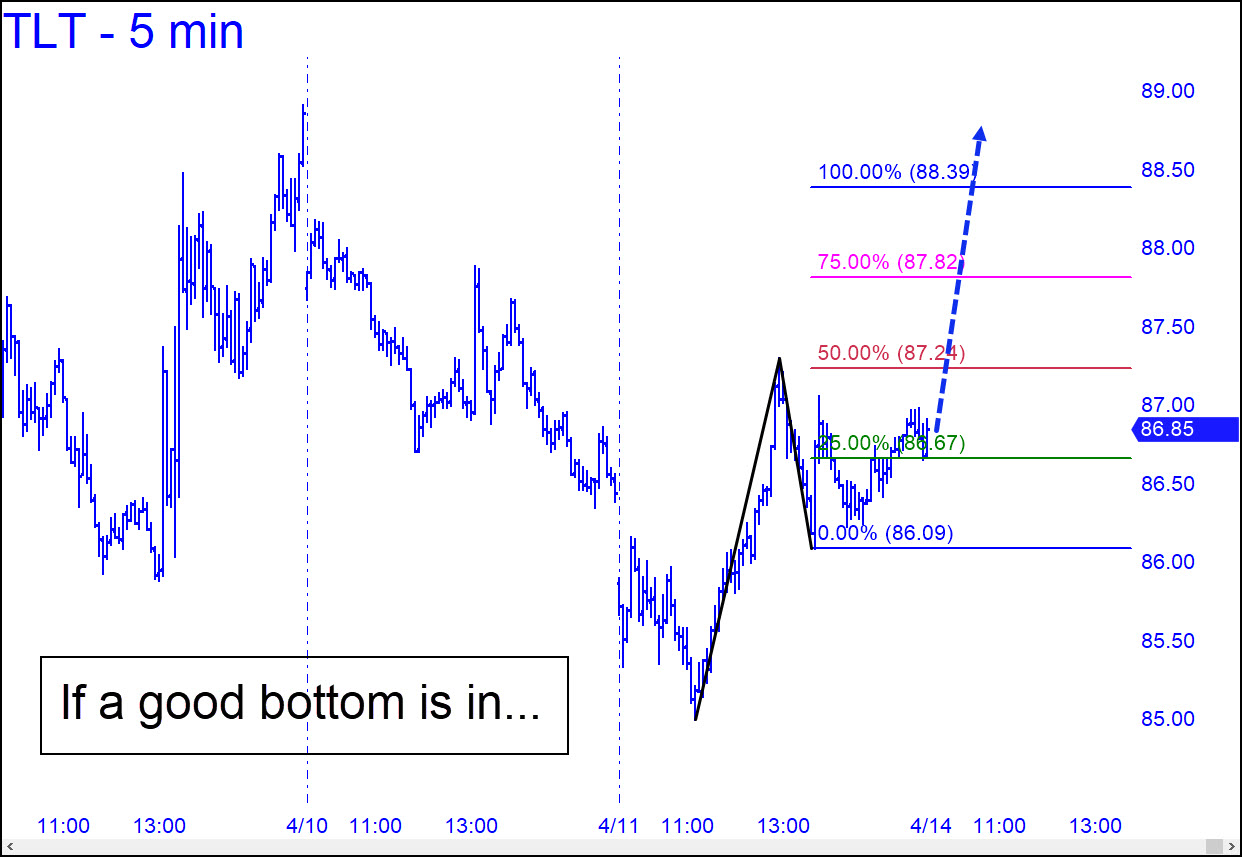
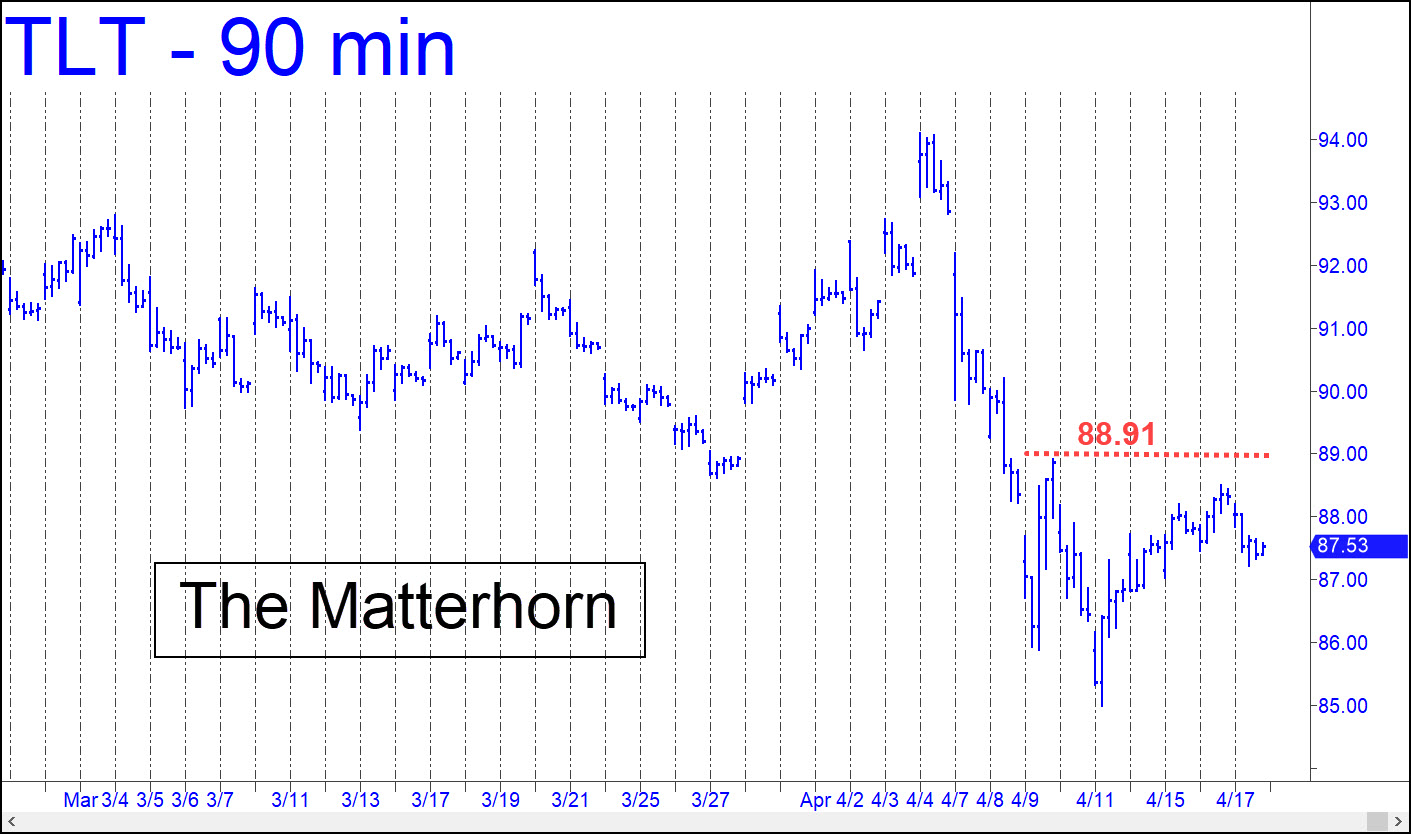
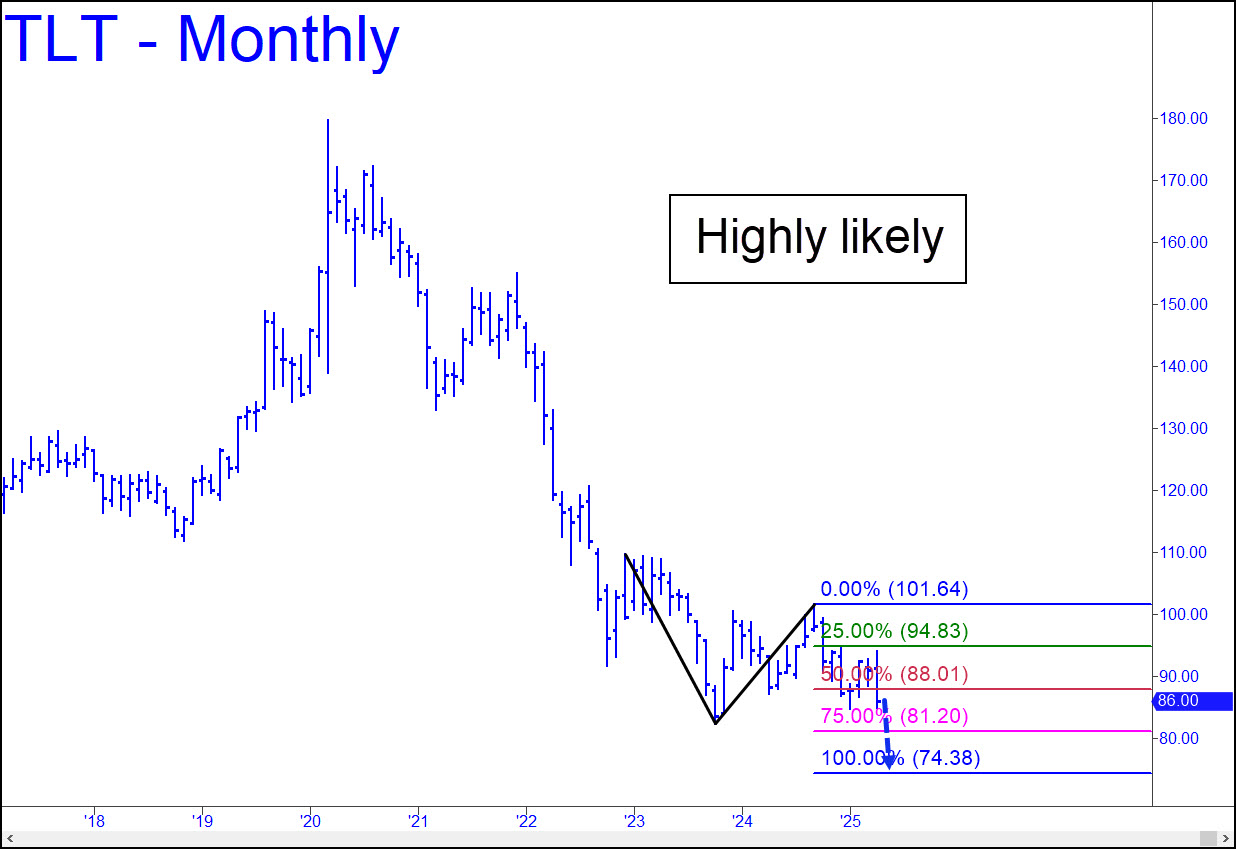
 Despite the hellacious dive over the last ten days, TLT is on a double buy signal. The more important of the two is shown in the weekly chart (inset). An 88.47 bid would require a stop-loss at 84.88, just beneath the pattern’s point ‘c’ low. You can see how close the low came to stopping out the position, but it held nonetheless — by 12 cents. T-Bonds were bound to turn around sooner or later, and the chart says this would be a logical place for it to happen. Odds that a major low is in place would shorten if this so-far modest bounce can push past D=88.39 of this minor pattern. _______ UPDATE (Apr 17): The tout above sniffed out a strong bounce, but not quite strong enough to lift TLT from the danger zone. That would require a thrust exceeding the 88.91 ‘external’ peak shown in this chart. My hunch is that bulls lack the gusto for this task, but we’ll give them the benefit of the doubt when trading gets under way after a long Easter holiday weekend. _______ UPDATE (Apr 21, 4:25 p.m.): Today’s carnage clarified a picture that shows an easy path down to 74.38. If this comes to pass, T-Bond futures could fall to as low as 100^12 by mid-summer.
TLT – Lehman Bond ETF (Last:86.21)
Posted on April 13, 2025, 5:21 pm EDT
Last Updated April 21, 2025, 6:26 pm EDT