
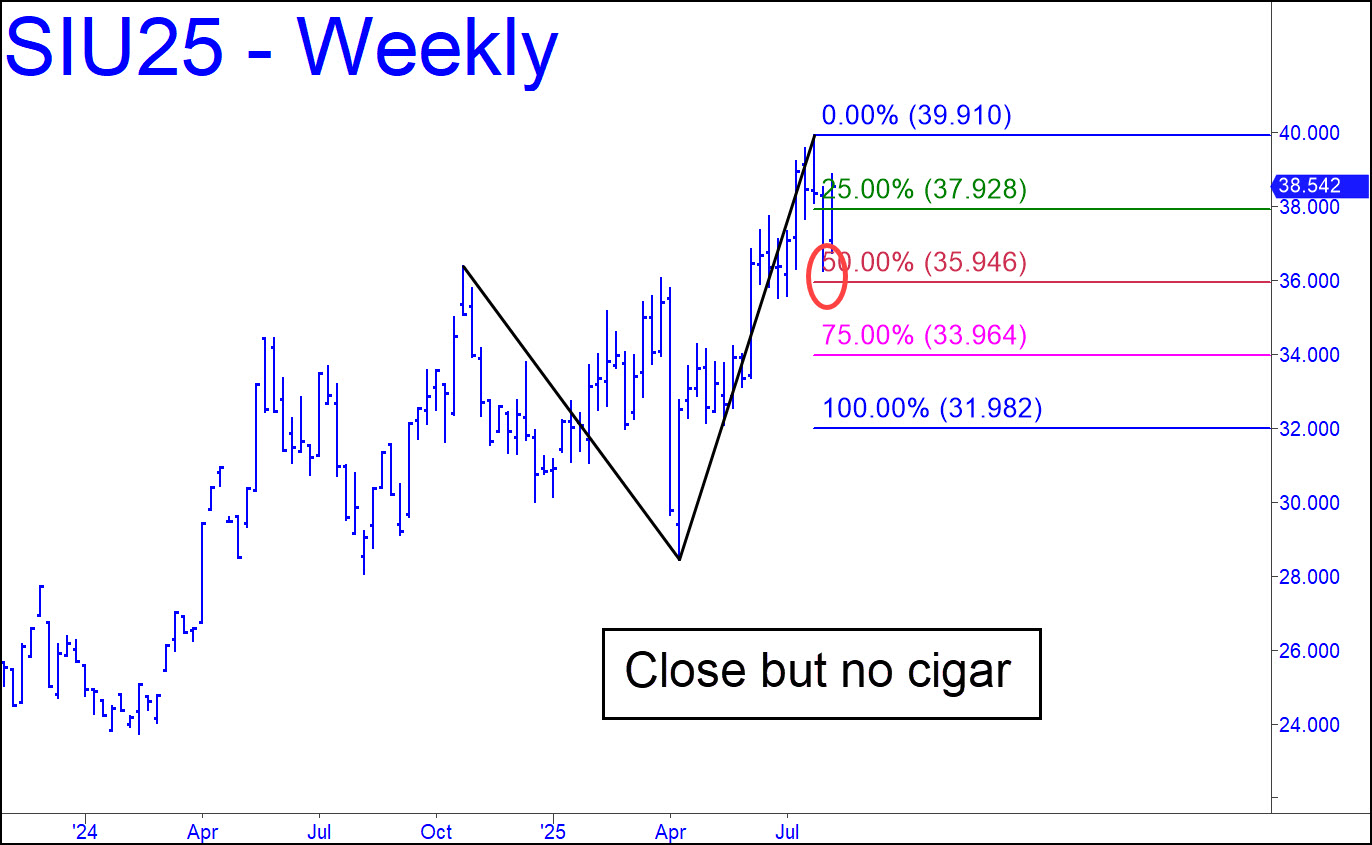
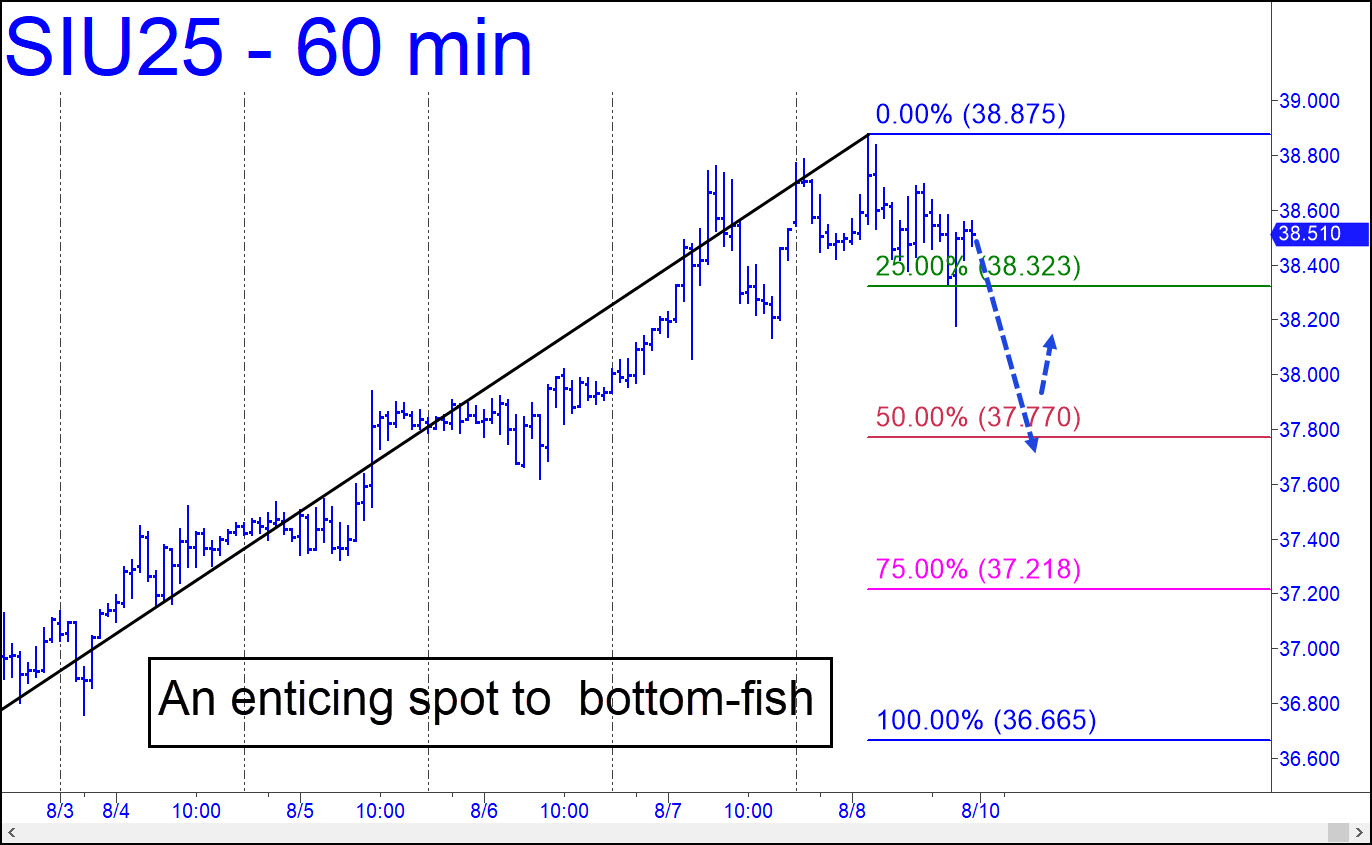
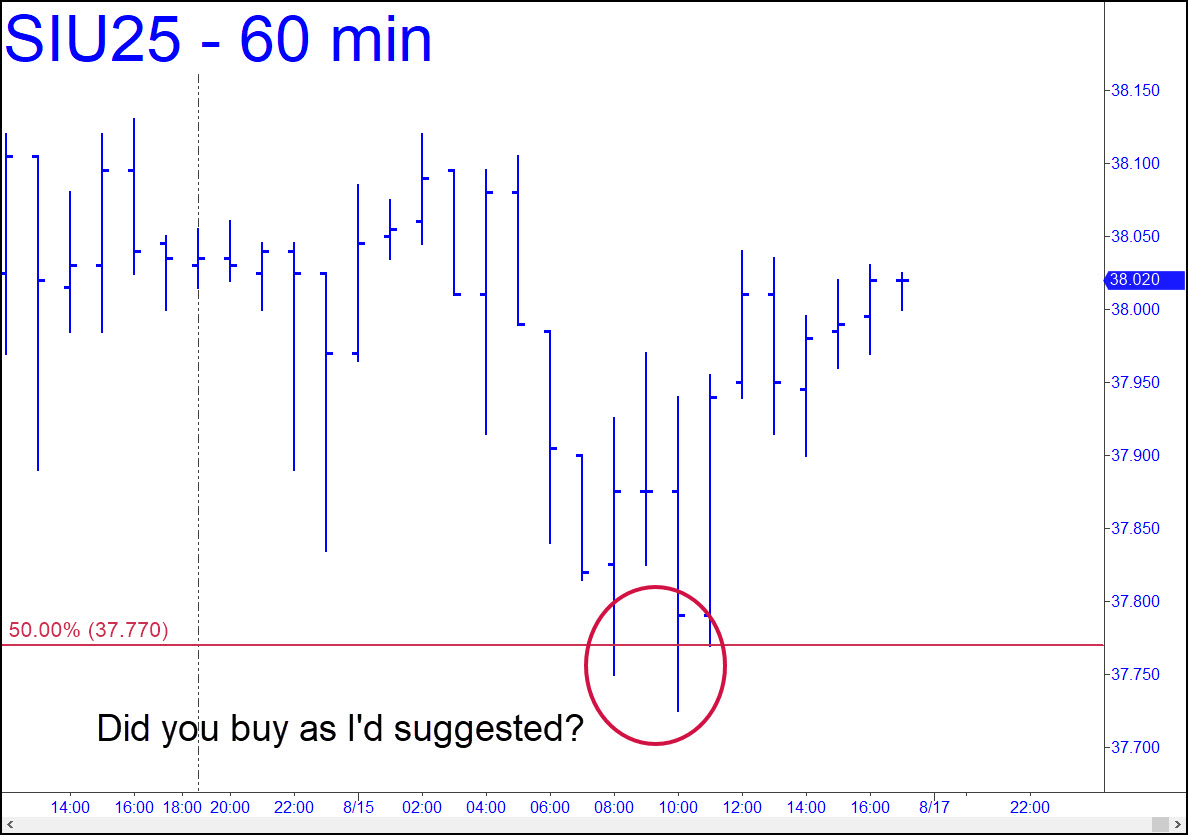
 I’d said the weekly chart shown could serve as a road map for the next couple of weeks, and that is still the case. This is notwithstanding the fact that the dipsy-doodle of the last two weeks did not quite come down to the 35.946 midpoint Hidden Pivot support where we’d intended to do some buying. The pivot is sill valid for bottom-fishing, although the failure of sellers to push the September contract down to it is bullish enough to suggest that the ‘c’ high (39.910) is a slightly less than even bet to get exceeded. The best way to get ahead of the action is to follow it on the hourly chart. Here it is, and it implies the first place we might attempt tightly stopped bottom-fishing would be at p=37.770. I have masked the ‘a’ and ‘b’ coordinates for proprietary reasons, but you can figure them out by working backward from the target. ______ UPDATE (Aug 16, 2:36 p.m.): It’s no fun playing to an empty house, so let’s hear some applause from those of you who bought down at 37.770 as I’d explicitly advised. Here’s how the chart linked above evolved, producing a theoretical profit so far of $1,400 per contract.
SIU25 – Sep Silver (Last:38.020)
Posted on August 10, 2025, 5:14 pm EDT
Last Updated August 16, 2025, 2:37 pm EDT