
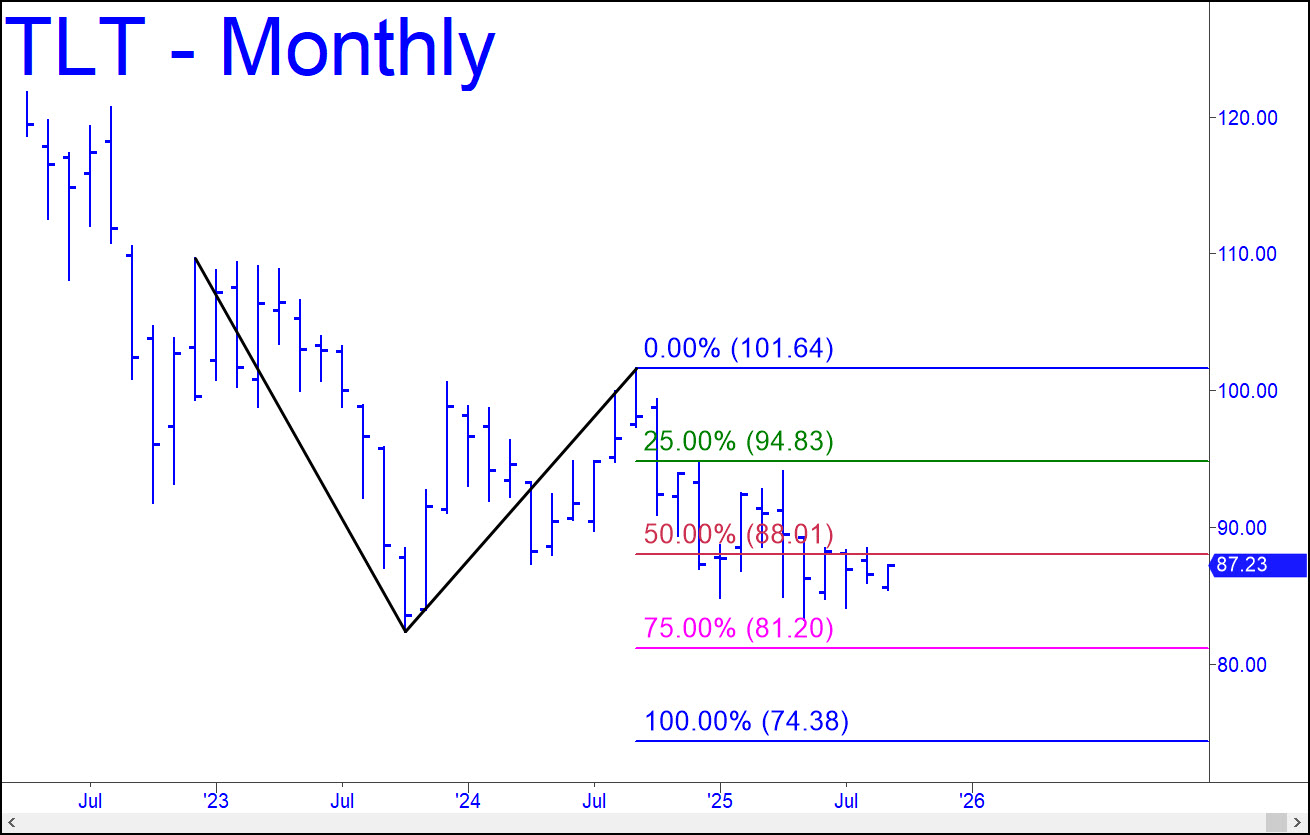
 It was nearly three years ago that TLT tripped a sell signal tied to a Hidden Pivot target at 80.84. This ETF proxy for T-Bonds was trading just above 102 at the time, and few could have imagined then that such a grim outlook was justified. The thumbnail chart shows an even darker possibility based on a long-term bottom at 74.38. But the graph also allows for a possible turn from p2=81.20, somewhat above our longstanding target at 80.84. This is what I believe will occur, since a further fall to 74.38, implying correspondingly higher long-term rates, would choke off expansionary pressures long before TLT could plunge to such depths. For now, though, you can use 81.20 as a minimum downside objective.
TLT – Lehman Bond ETF (Last:87.23)
Posted on September 4, 2025, 6:23 pm EDT
Last Updated September 4, 2025, 6:23 pm EDT