
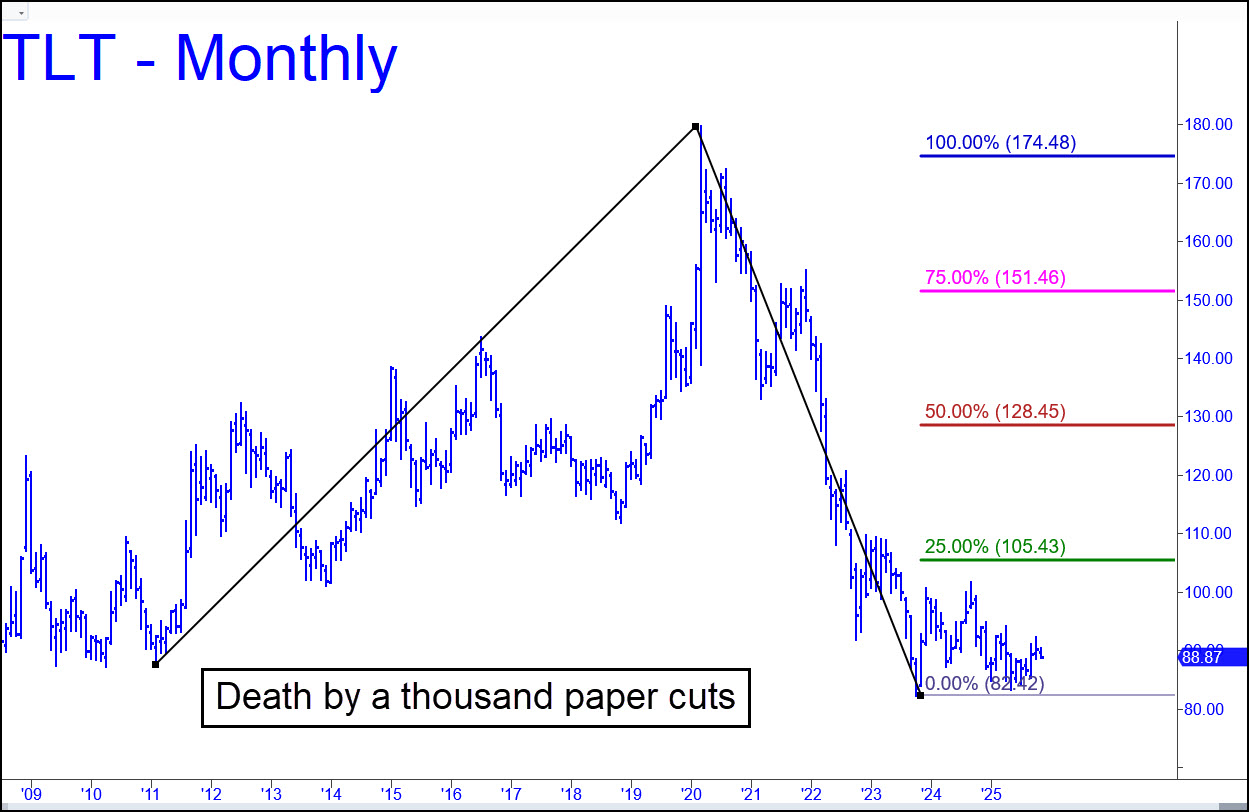
 My hardcore deflationist point of view has saddled me with a bullish bias whenever I ponder a T-bond chart. Although this allowed me to catch the October 2023 bottom just off the low, it also caused me to see the nearly two-year dirge that has occurred since as base-building for a long bull market that has yet to materialize. I don’t doubt that it’s coming, presumably in conjunction with the next recession. But TLT’s chart suggests it could take many months before it rises and, inversely, yields begin to fall. In the meantime, look for it to scuddle sideways, with a moderate bias to the downside that would correspond to merely somewhat higher long-term rates. Altering our expectations in this way can help diminish the distraction of believing Trump can do something about it — i.e., about rates determined by markets, and about high levels of debt that are crushing America’s middle class. He can’t, and his expansionist, credit-driven economic policies will only exacerbate the bearish trend in bonds. Suppose the small rise in their price over the last two years has completely discounted the global appeal of Trump’s bold leadership and the additional demand this has created for U.S. Treasury paper. In that case, it’s hard to imagine a bullish surge in T-bonds when the President’s inflationary policies produce the opposite of instant economic miracles: stagflation. ______ UPDATE (Dec 3): TLT is breaking down in the context of a bearish head-and-shoulders pattern begun three months ago. This is within the scope of my original tout (see above), which was intended to provide a much more accurate picture for long-term rates than the guys and gals with degrees in economics who toss darts to predict such things. Rising rates and inflation are going to increasingly hurt Trump’s credibility and popularity as long as he keeps telling us that the U.S. economy is doing great. Not for the broad middle class, it isn’t.
TLT – Lehman Bond ETF (Last:89.06)
Posted on November 16, 2025, 5:22 pm EST
Last Updated December 3, 2025, 6:28 pm EST