
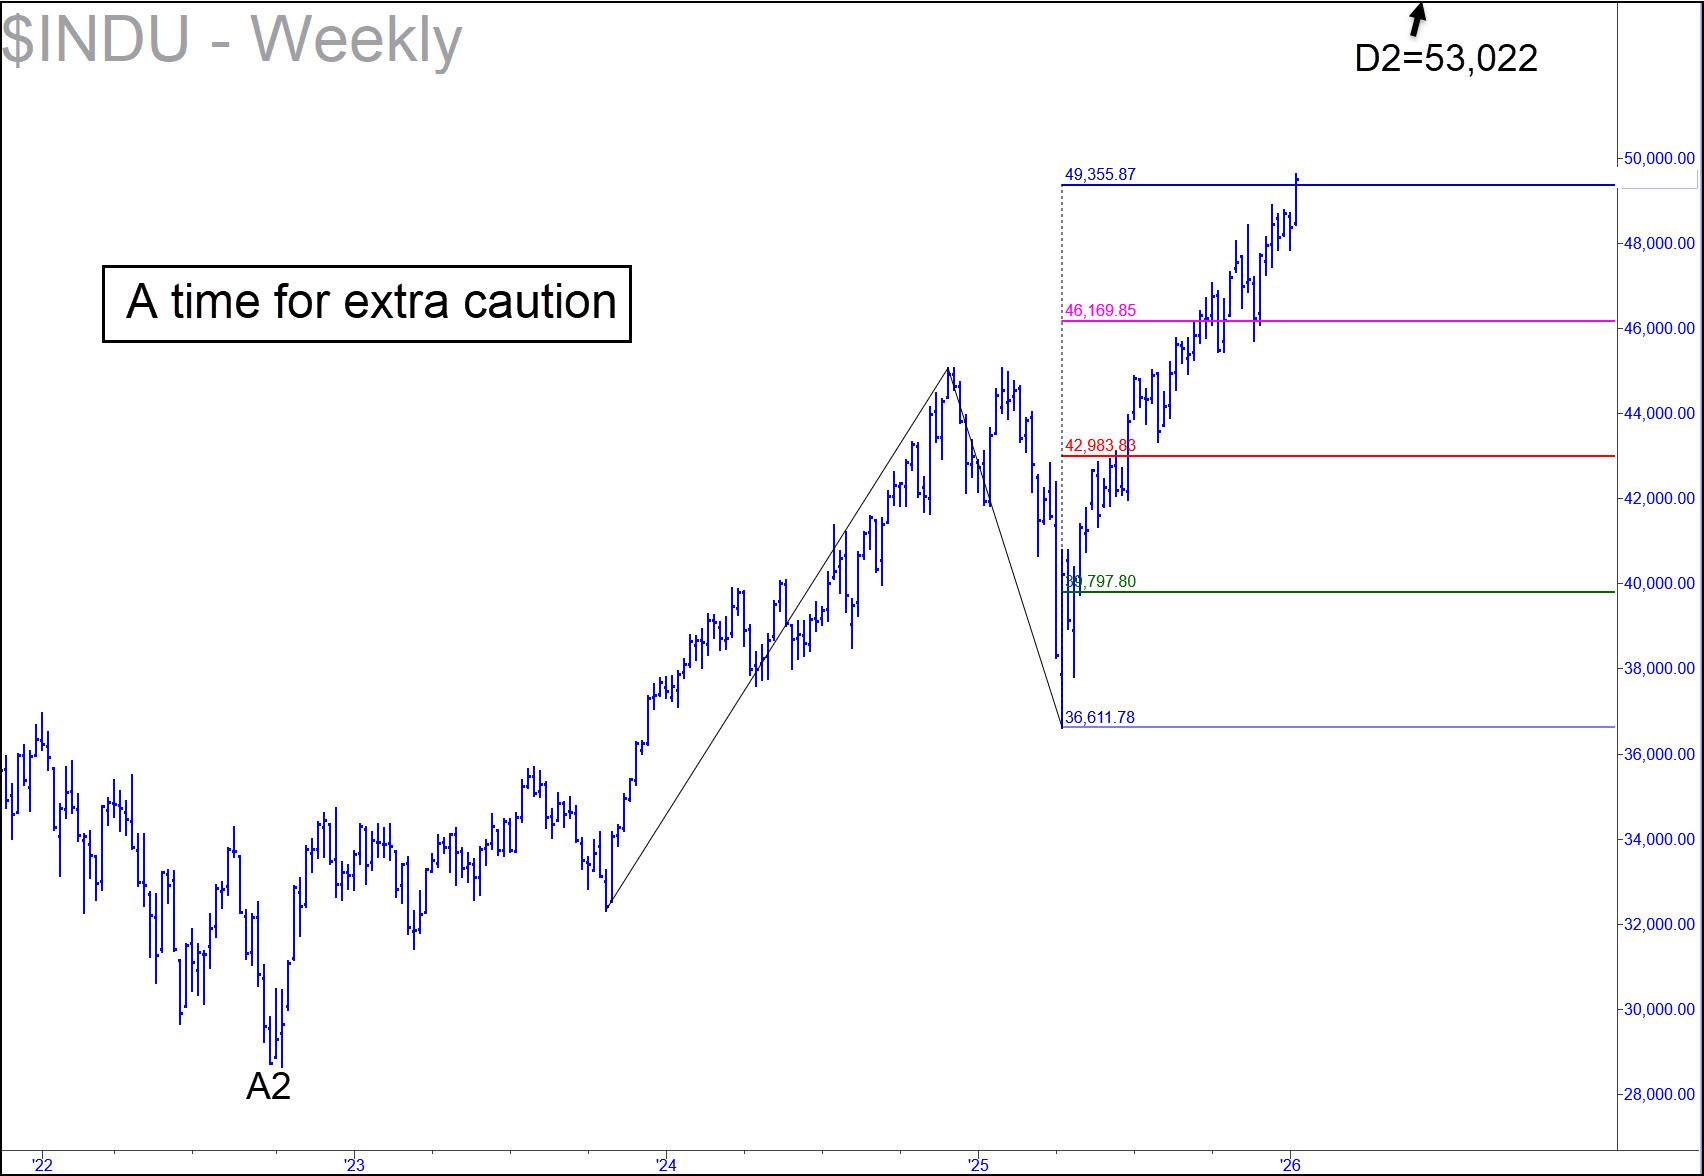
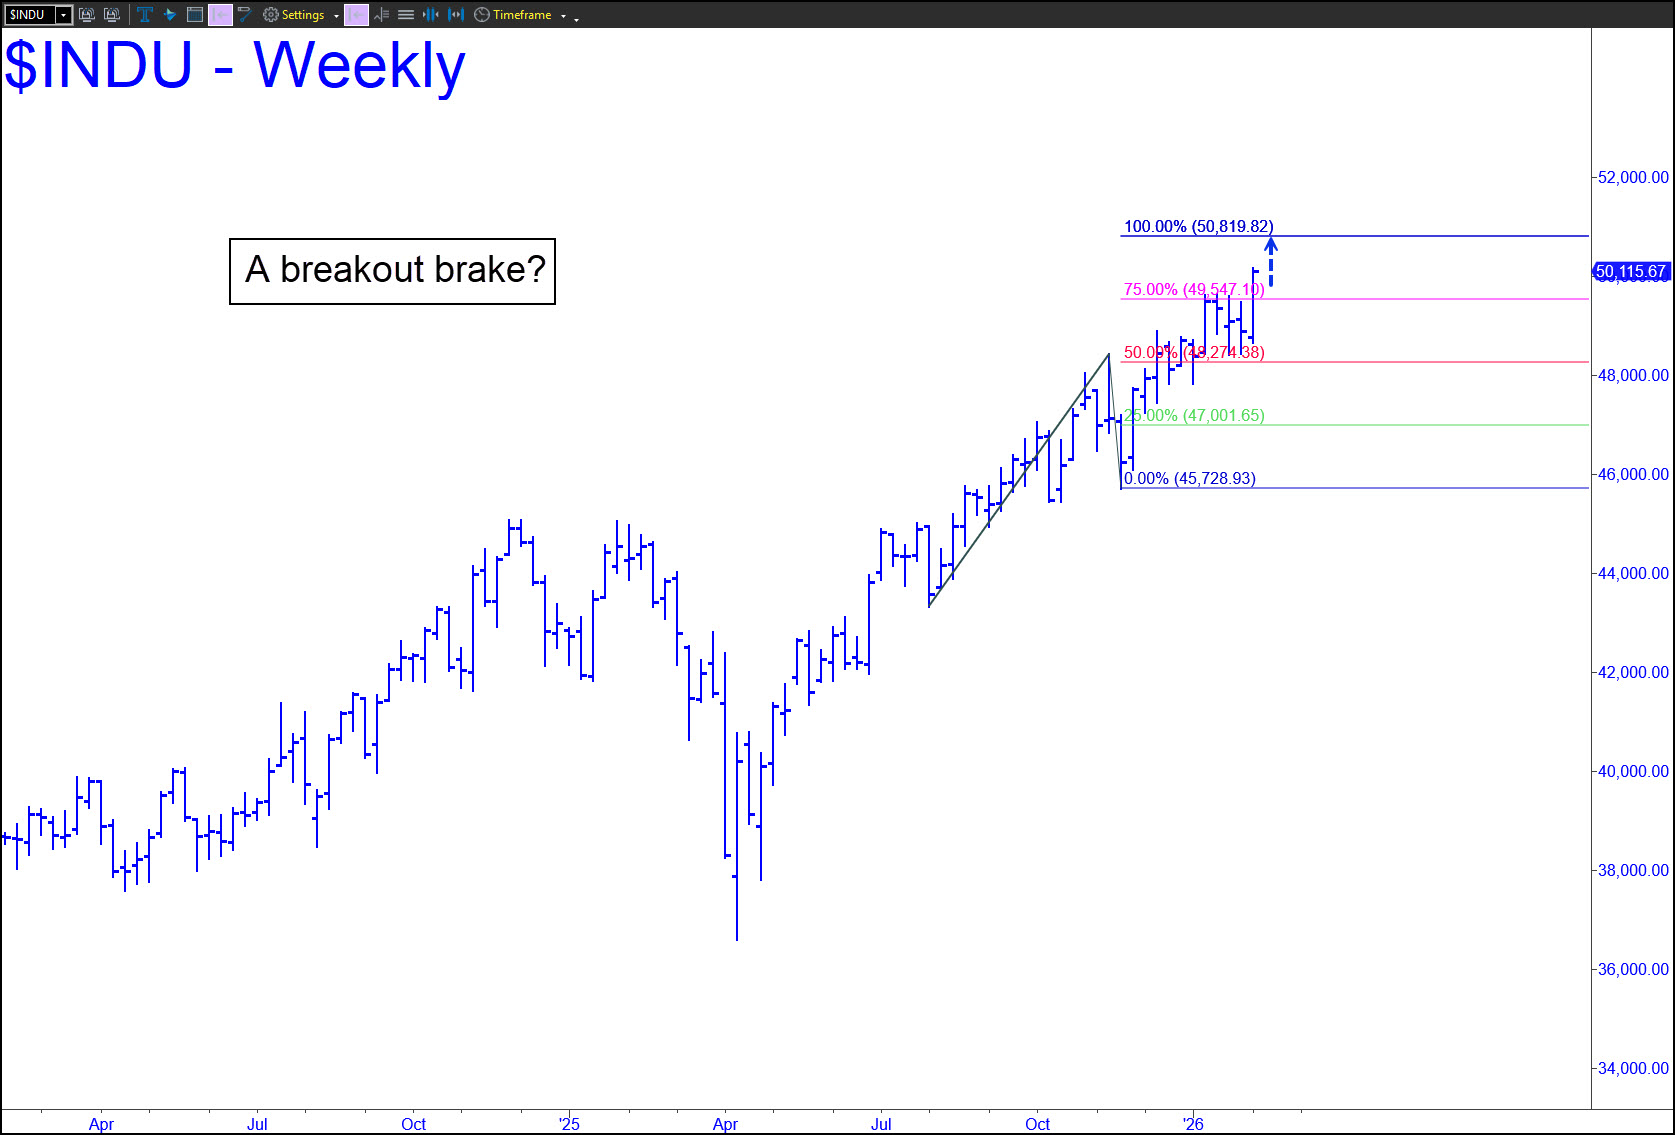
 The chart is featured in the current commentary, but let me add a cautionary note for subscribers only. The 50K milestone that lies just a hair above Friday’s record settlement closely coincides with the 49,355 ‘D’ target of the pattern shown in the inset. My gut feeling is that the so-far slight overshoot of the target happened because traders were intent on hitting 50K regardless of any Hidden Pivots that may have stood in the way. We should infer in any case that there is double stopping power here, and that a significant pullback is distinctly possible, even if it turns out not to have been the start of a bear market. Since we should always have a higher target ready just in case, the 53,022 Hidden Pivot noted in the upper-right corner of the chart can serve that purpose. Assume it will be achieved if the Indoos close for two consecutive weekly bars above 50,600. _______ UPDATE (Jan 30): The Dow has been jerking bears’ chains with a Wile E. Coyote dance inches from the potential top I’d warned about at 50,000. Sellers will need to penetrate the red line (p=48,270), however, before I can diss this gas-bag with enthusiasm and still sound credible. Even then, it would be a good bet to fall no further than D=46,918, hinting that the broad averages, unlike bullion, are in shallow correction that will cause little pain or even anxiety. _______ UPDATE (Feb 8): The Dow broke out last week, but the follow-through could be less than spectacular. This chart shows a compelling Hidden Pivot resistance at 50,819, just 704 points, or 1.4%, above Friday’s closing price. _______ UPDATE (Feb 20): No change: 50,819 still looms as a potentially important number.
DJIA – Dow Industrial Average (Last:50,115)
Posted on January 11, 2026, 5:22 pm EST
Last Updated March 14, 2026, 3:18 pm EDT