
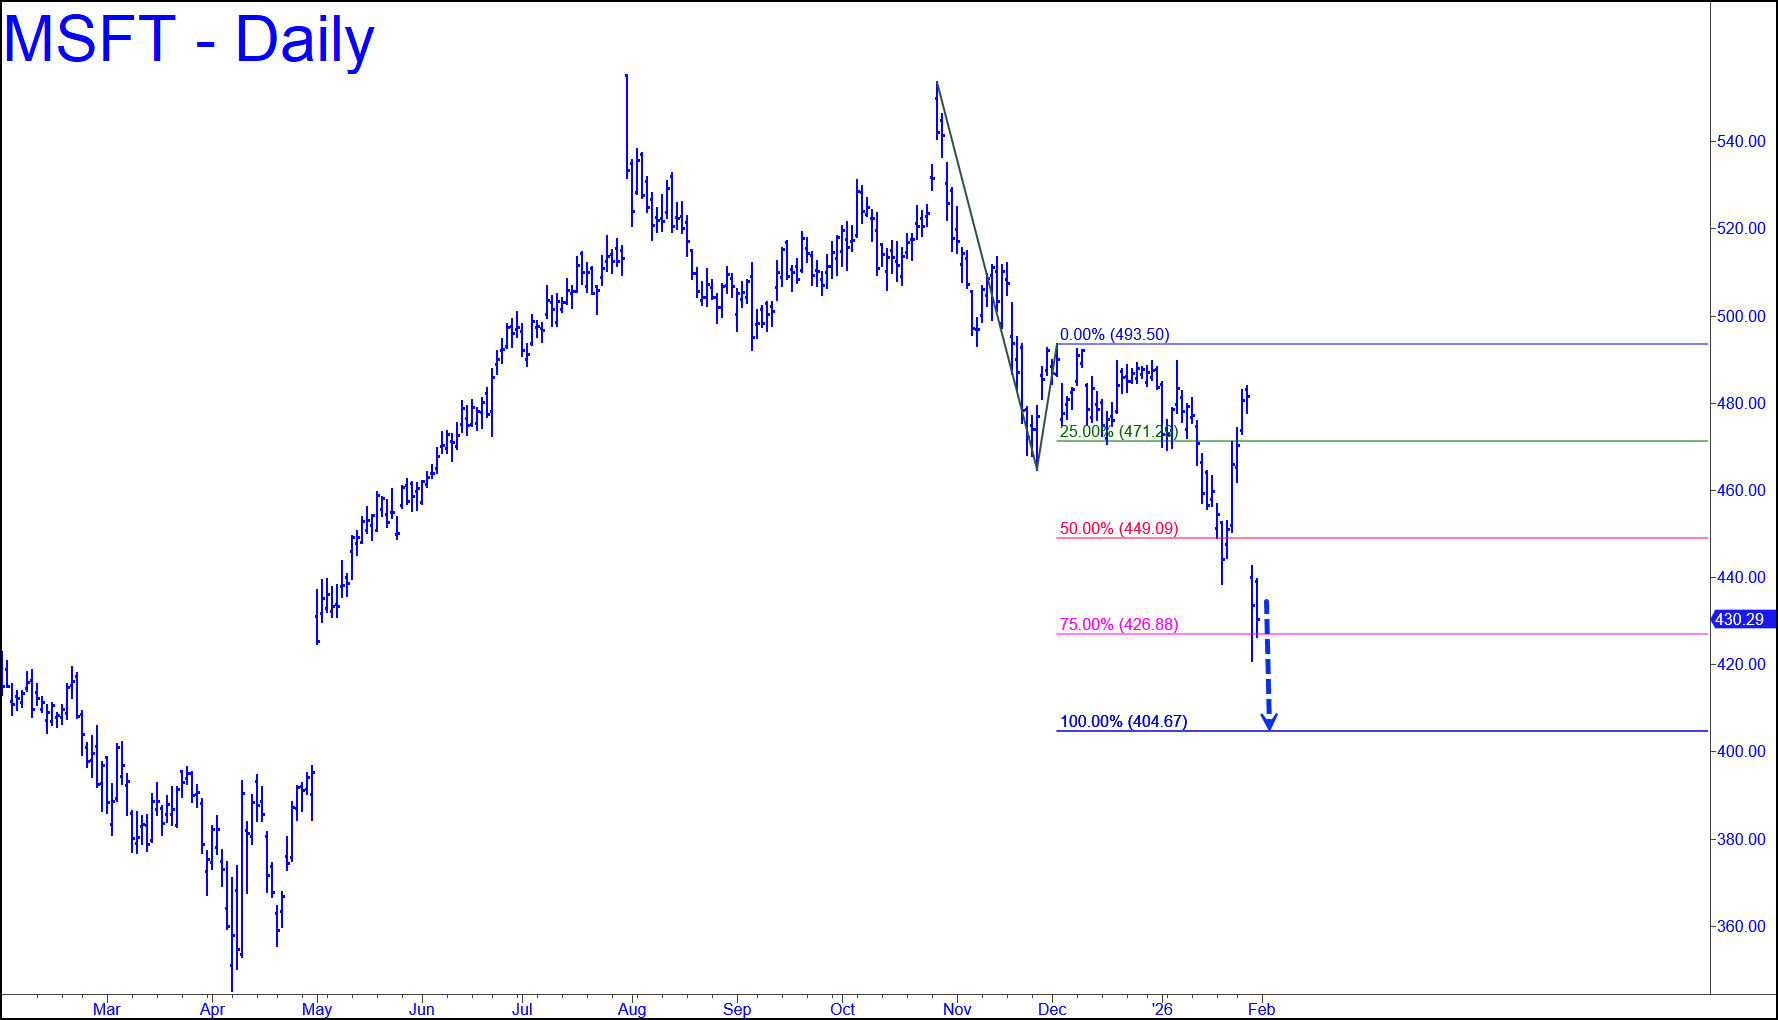
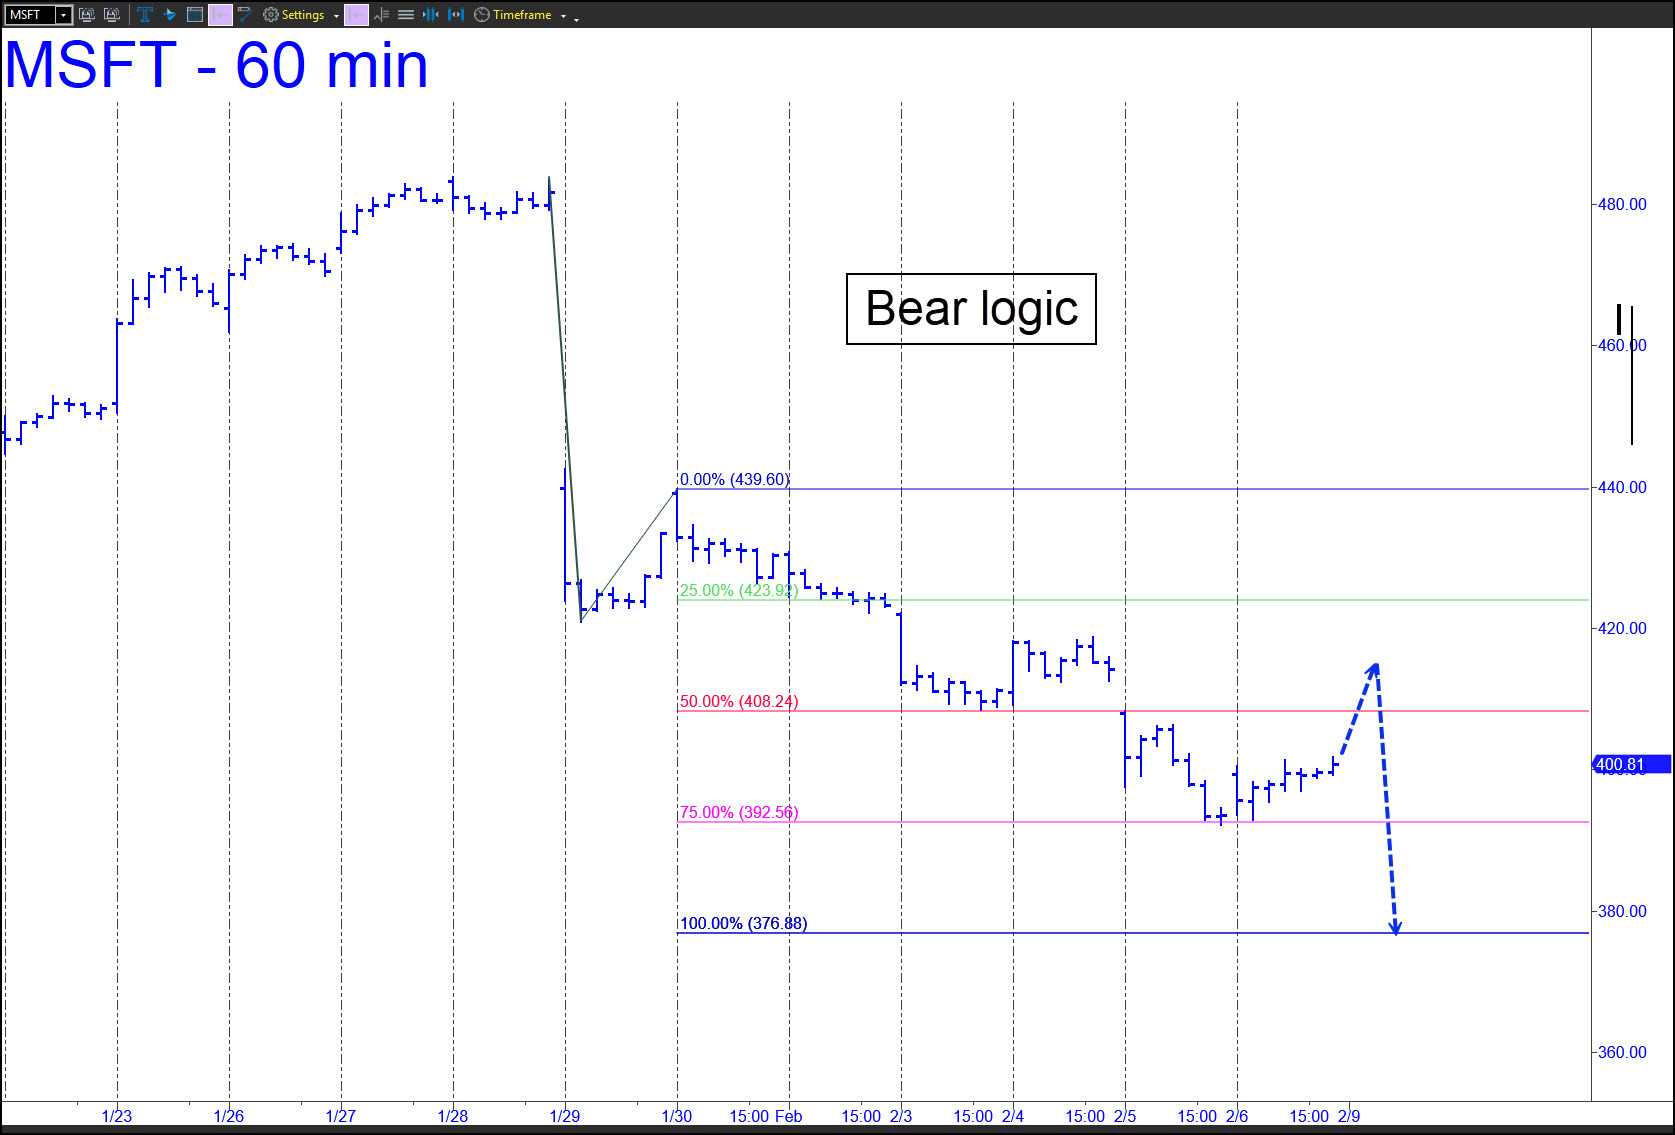
 A further fall to the 404.67 target would represent at 27% decline since the stock sputtered out in October at 553.72, just an inch shy of new record highs. The pattern doesn’t quite qualify as an ominous, island-reversal top, but it doesn’t take a chartist to feel the weight of the dome the stock has traced out over the last nine months. The pattern is simple and obvious, but sufficiently compelling for us to infer that MSFT is far more likely to hit D before C=493.50, if it ever does. This is the fourth most valuable company in the world, behind Nvidia, Google, and Apple, implying that the stock’s decline has deflated the global ‘wealth effect’ by a large amount. See this week’s commentary (above) for a further discussion of this. _______ UPDATE (Feb 8): The stock has looked so awful that I am substituting AAPL on the ‘touts’ list. The chart shows a logical path down to D=376.88. The stock can be ‘mechanically’ shorted at the red line (p=408.24), stop 418.70. ________ UPDATE (Feb 14): We usually do ‘mechanical’ shorts at the green line, but I made a rare exception this time, recommending that you get short at the red line (p=480.24) with a 418.70 stop-loss. The trade would have produced a loss of $1024 per round lot. Had we shorted at the green line (x=423.92) as is customary, the trade would have worked out nicely, since the stock made a top at 423.68 just ahead of a so-far plunge of $22.67. The 376.99 downside target remains valid in any case and should be used as a minimum objective for now.
MSFT – Microsoft (Last:400.81)
Posted on February 1, 2026, 8:19 pm EST
Last Updated February 14, 2026, 12:28 am EST