
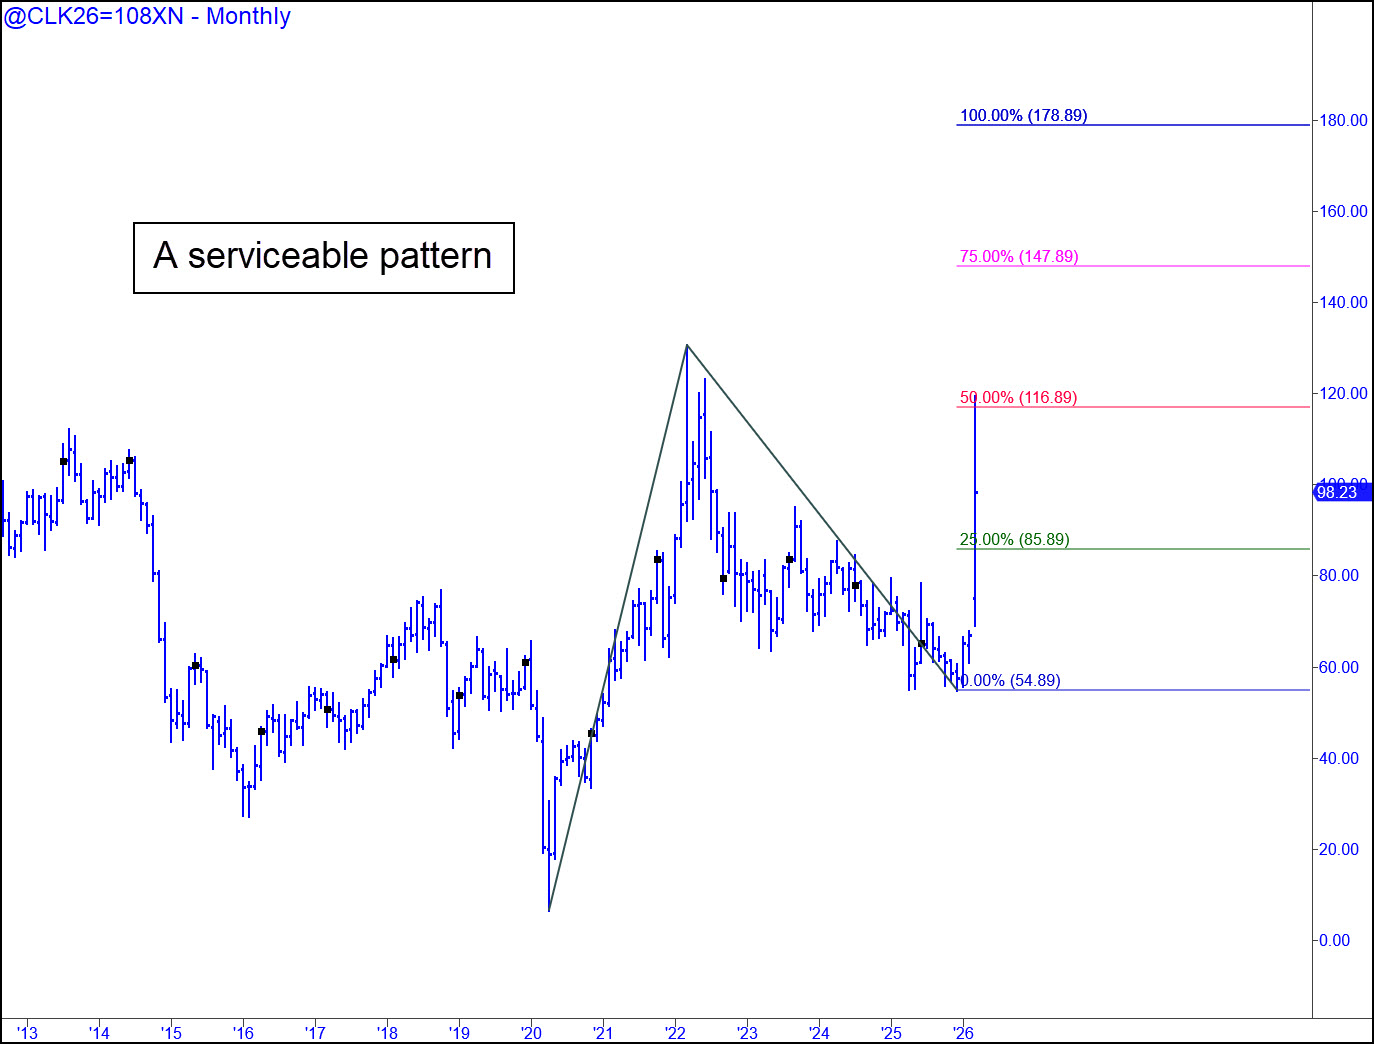
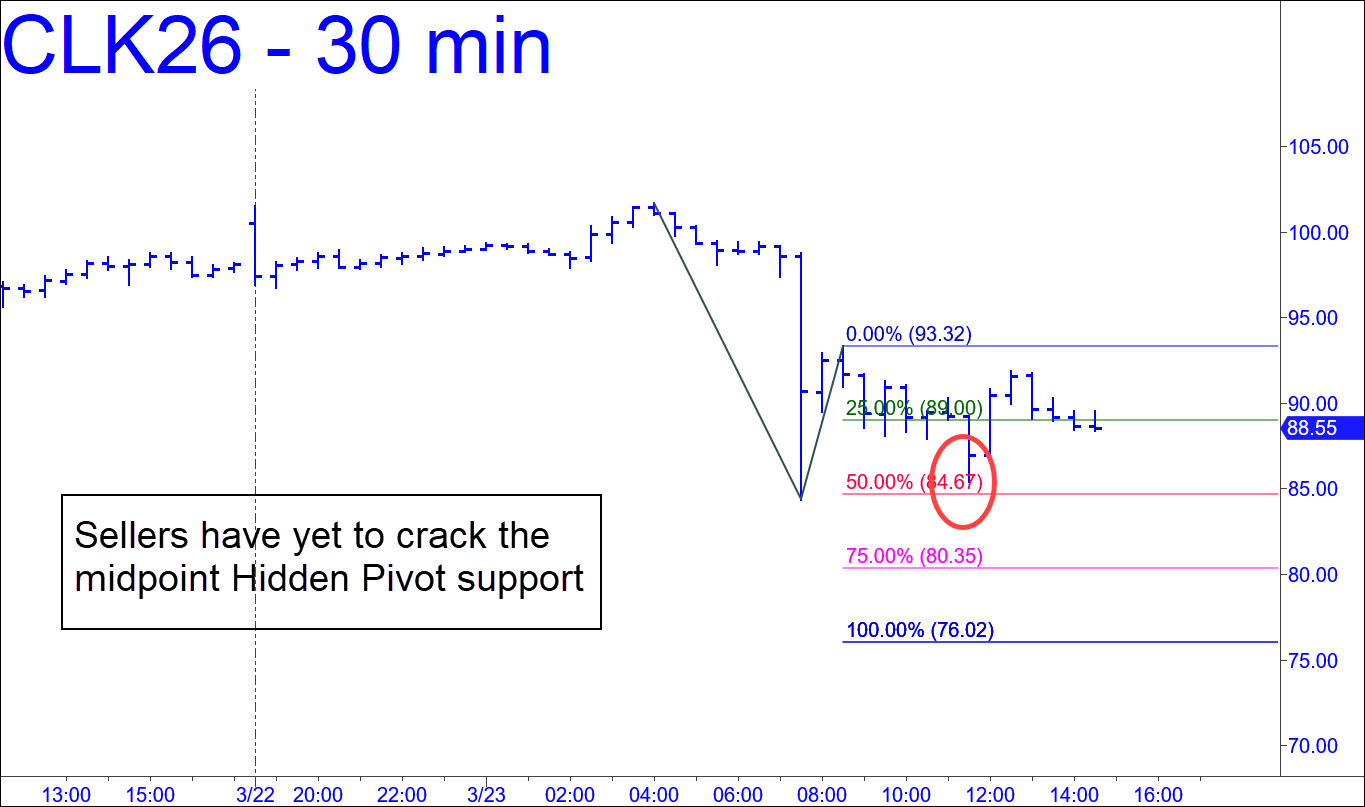
 The pattern shown is not of the bluest pedigree because of its obviousness. However, it is almost certain to be useful if you plan to trade the big swings or merely want to know with confidence how oil prices are likely to behave in the weeks and months ahead. The chart is a composite, so don’t expect the levels to perform exactly. However, even so-so patterns have midpoint Hidden Pivots that ‘work’, so we should take last week’s stall precisely at p as a sign of this particular pattern’s reliability. We don’t know yet whether the futures are about to blow past p=116.89, but if they do, take it as a sign they are not merely capable of reaching a record 178.89, but that this is likely. Also, although a relapse to the green line (x=85.89) would likely produce a global sigh of relief, from our perspective it would set up a juicy ‘mechanical’ buy, stop 54.88, that implies yet another big price leap capable of incapacitating the global economy. Bloomberg has quoted the usual Wall Street shills as saying crude prices would have to hit a minimum $128 and stay there for a while to bring on a recession, but these guys are such liars and morons that nothing they say can be trusted. The same could be said of 90% of the news and commentary emanating from Bloomberg, which is the most Trump-deranged of all the major news outlets. They really hate the guy, and everything they report on him has an extremely negative slant, even to the point of their hoping Iran wins the war. _______ UPDATE (Mar 23, 2:06 p.m.): I hadn’t expected crude’s psychotic swings to touch the green line (85.89) so soon, but they did, triggering a ‘mechanical’ buy there that could have produced a profit of as much as $7430 per contract on the subsequent rally. The actual low occurred at 84.37, underscoring the fact that ‘x’ is not a target, support or a Hidden Pivot, just a level that helps us set up certain types of trades. In this case, entry was best managed with a ‘camo’ trigger rather than a by-the-book stop-loss just below C=54.89. The tightest, visually evident trigger interval on the one-minute chart was 34 cents (a=97.40 at 6:511 a.m.), implying $340 of initial risk per contract. It is too early to tell whether a bottom is in for the retracement, but here is the pattern that can tell us as it develops.
CLK26 – May Crude (Last:88.71)
Posted on March 22, 2026, 5:18 pm EDT
Last Updated March 23, 2026, 2:15 pm EDT