
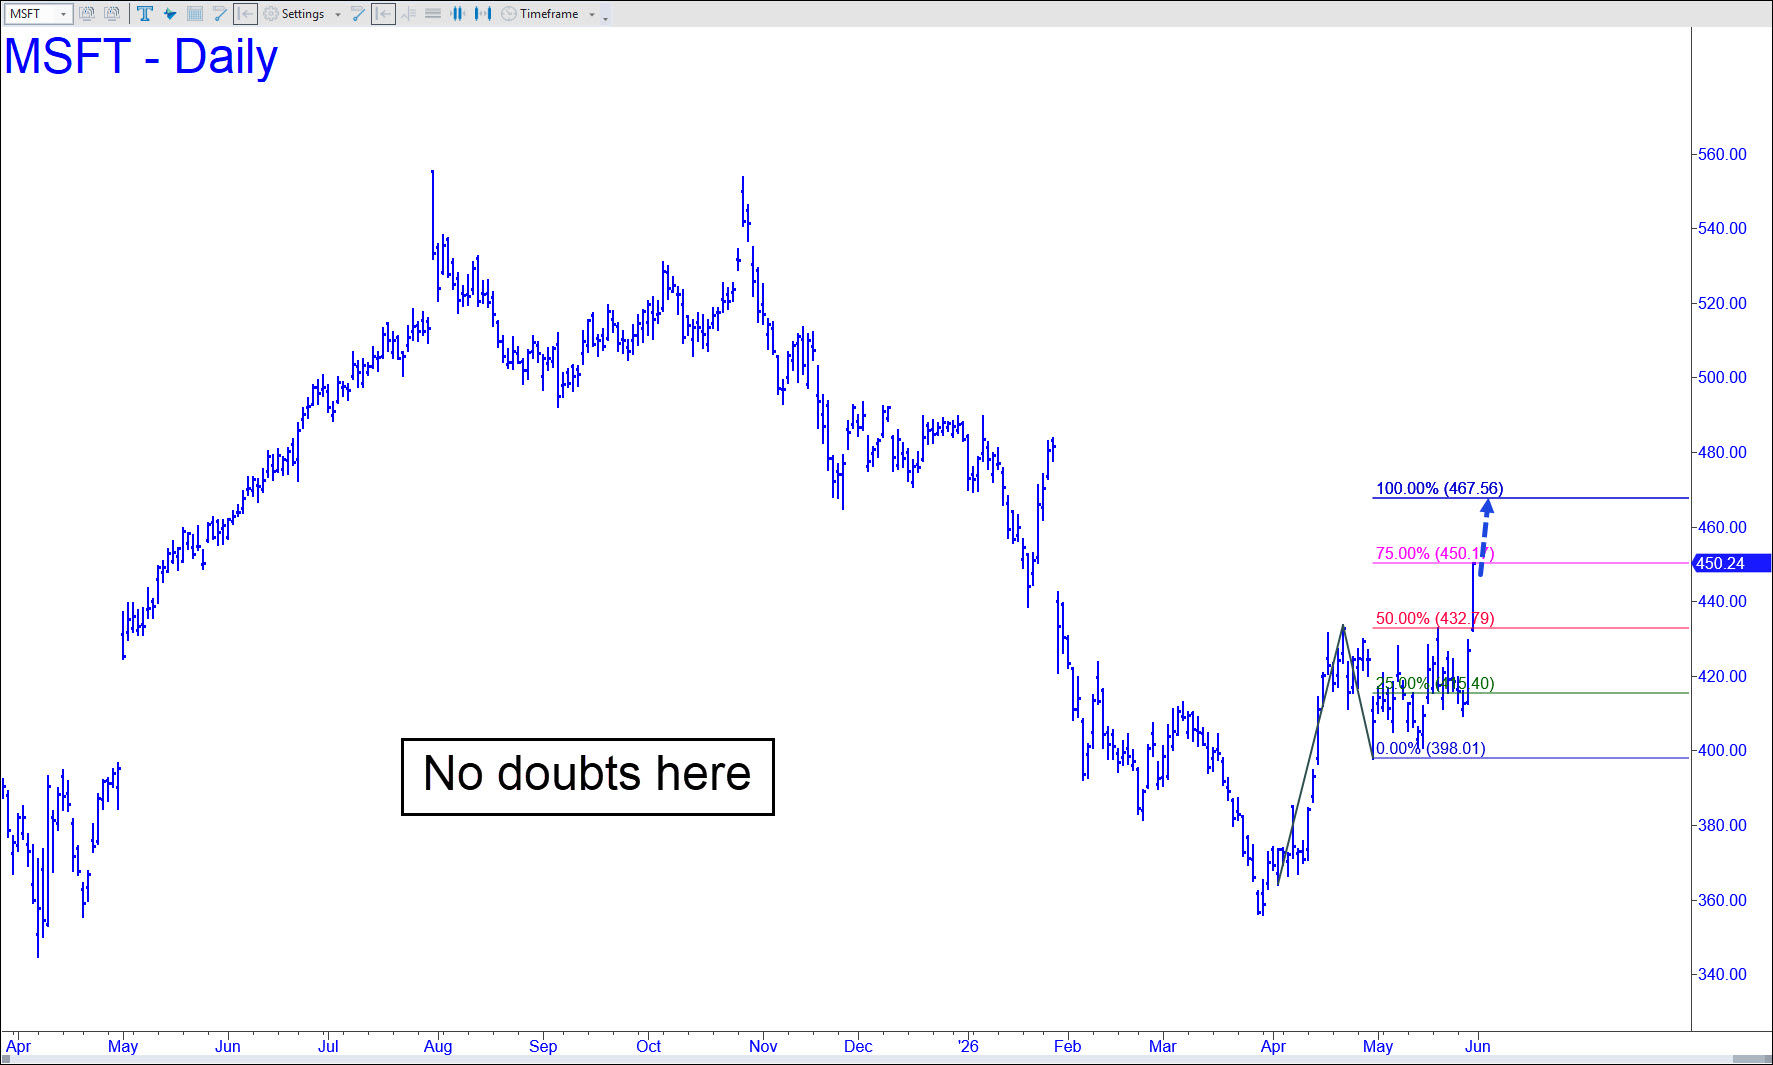
 The chart makes clear not only that MSFT will achieve the 467.56 target shown, but also that it will form a tradeable top there. The target represents a slight adjustment made possible by the precise pullback from the midpoint Hidden Pivot (p=432.79), and by the profitable buy signaled on the pullback to the green line. This means the pattern is working, and that the ‘D’ target at 467.56 will have tradeable consequence in both directions. A pullback to the secondary pivot (p2=432.79) could be bought with a 421.20 stop-loss, although a ‘camo’ trigger is suggested to shrink the implied risk of more than $11 per share.
MSFT – Microsoft (Last:450.24)