
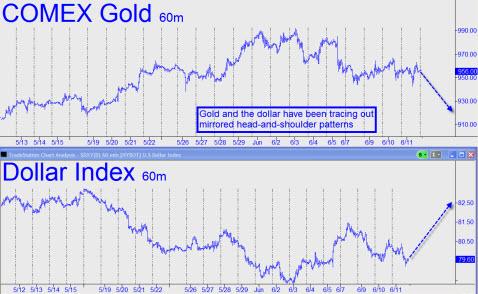
We’ve never been gung-ho about head-and-shoulder patterns, mainly because they seem to pop up everywhere you look for them. Even so, there’s something to be said for the elegant simplicity of the two head-and-shoulder formations show in the charts below. The top chart is a bearish pattern in Comex August Gold that has been gestating for nearly a month. Its mirror image, shown in the Dollar Index chart below it, is a bullish, reverse head-and-shoulders that has been taking shape over the same period. If both patterns were to play out in textbook fashion, gold futures are about to take a spill, and the dollar to rise commensurately, within the next few days.
Textbook patterns aside, evidence has been accumulating in recent weeks that gold is not quite ready yet to blow past $1000 once and for all. Our target for the August Comex contract, currently trading near $960, has been $1066; however, on the intraday charts, every time buyers take a running start at the Promised Land, the rally loses steam before it can surpass the two prior peaks that Hidden Pivot analysis requires to signal an impulsive move. And even when the requirement is met on the very lesser charts – say, the 1- or 3-minute bars — it is invariably matched by a move of equal magnitude in the opposite direction. We refer to this dynamic as “dueling impulse legs,” and it suggests that traders are locked in a dither.
More dithering would be all to the good as far as the dollar is concerned, since a sustained rally would increase the deflationary pressure on all who owe dollars. At some point, if these debtors can no longer continue to roll their loans, they will be forced to settle up in cash, potentially create a dollar short-squeeze. But even if panic conditions do not develop, a merely modest run-up in the dollar would be bad news for the economy. It is surely the last thing the government wants, or could have anticipated, in its panicked efforts to breathe a whiff of inflation into America’s imploding financial edifice.
***
Calling All Traders…
Ever found yourself sitting on your thumbs after the opening bell, waiting for the dust to settle? If so, then you know how much harder it becomes to trade profitably as the day wears on. That’s because once a market has established an opening range, trading becomes essentially a frustrating game of second- and third-guessing other traders who are trying to second-guess you.
But suppose you were able to predict the high or low of the opening range beforehand? Using your crystal ball, you could be waiting at the bell with your bid or offer, ready to pounce on what will later turn out to be at the high or low of the day. Wouldn’t that be a trick!
That is exactly what we attempt to do each morning, using the Hidden Pivot Method to spot predictive price patterns that may have occurred overnight. If you want to see how this is done, and how precisely, please join me for The Morning Briefing each day before the opening this week and next. These 20-minute sessions will commence online sharply at 9:00 a.m. EDT. Our goal will be to identify trading opportunities for that day, with a particular emphasis on Comex Gold futures and the E-Mini S&P. The Morning Briefing will be open to all, but to sign up you will need to register by clicking here. See you Friday morning!
It sure look’s like a head and shoulders pattern for gold. With the stock market up big time since March 9th, and with mortgage and refinancing’s near the low’s, IMO we are headed for a short term correction in the stock market and commodities. I sold 50% of PM stocks and will buy again in September. Have a good vacation!
ps: Also, not to add insult to injury, the most important mid-term elections is not until 2010. The Democrats still have alot of time to get their act together. IMO, they can afford right now to still blame the Republican’s, if they play their card’s right! As a Democrat, I hope they will!