
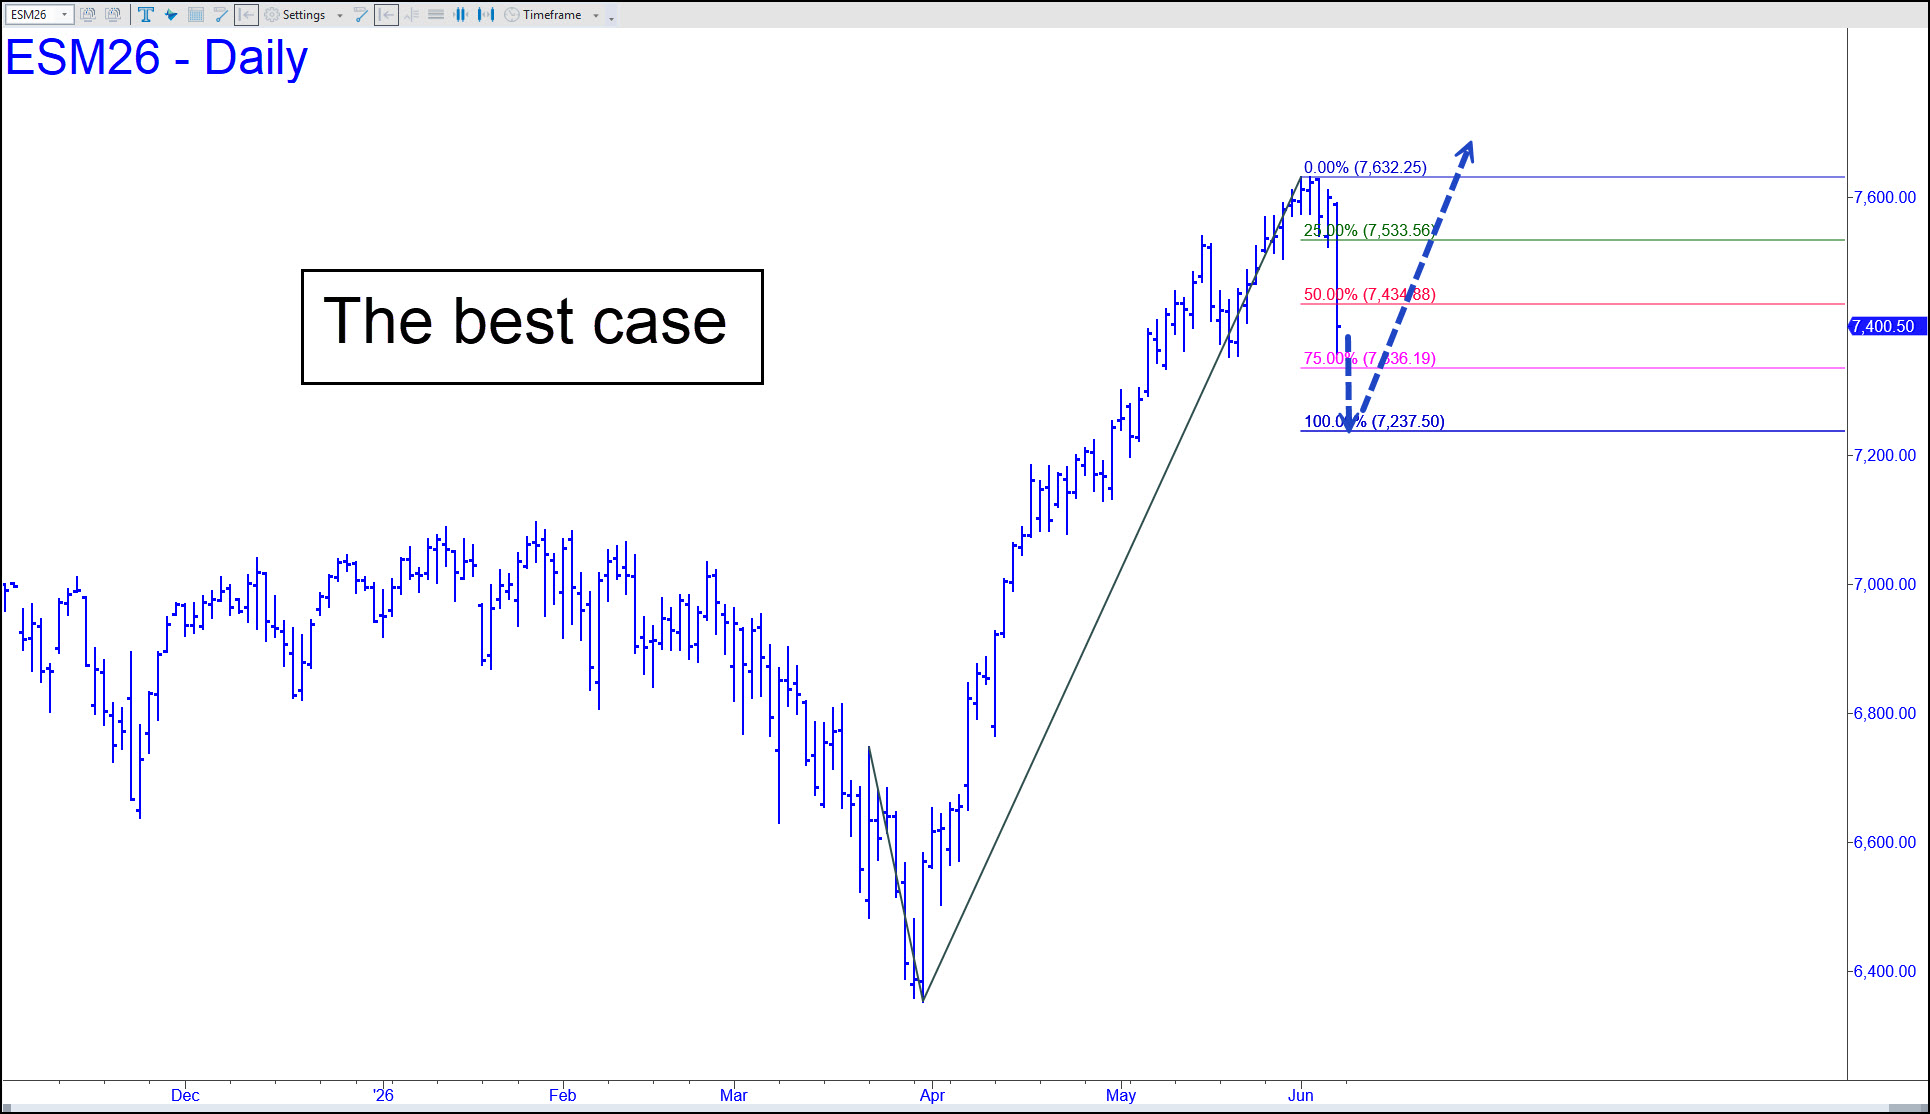
 Friday’s plunge implies the selling will continue down to at least 7260.50, a midpoint Hidden Pivot tied to a worst-case target for the next 6-8 weeks of 6889.00. A stall at 7260.50 followed by a decisive breach would shorten the odds that the target will be reached. However, the chart shown depicts a somewhat less bearish scenario ending in a correction low at 7237.50. It also says that shorting a rally to the green line (x=7533.50), stop 7632.50, would enjoy excellent odds for turning a profit. Now the bad news: Judging from the way sellers crushed p=7434.88 (the red line, a midpoint Hidden Pivot), d=7237.50 is all but certain to be achieved. Since that would exceed the 7260.50 midpoint of the larger pattern, opening a path down to the worst0case 6889.00 pivot, we’ll need to monitor price action very closely over the next 2-3 weeks to determine whether this is just a moderate correction or the start of a bear market.
ESM26 – June E-Mini S&P (Last:7400.50)