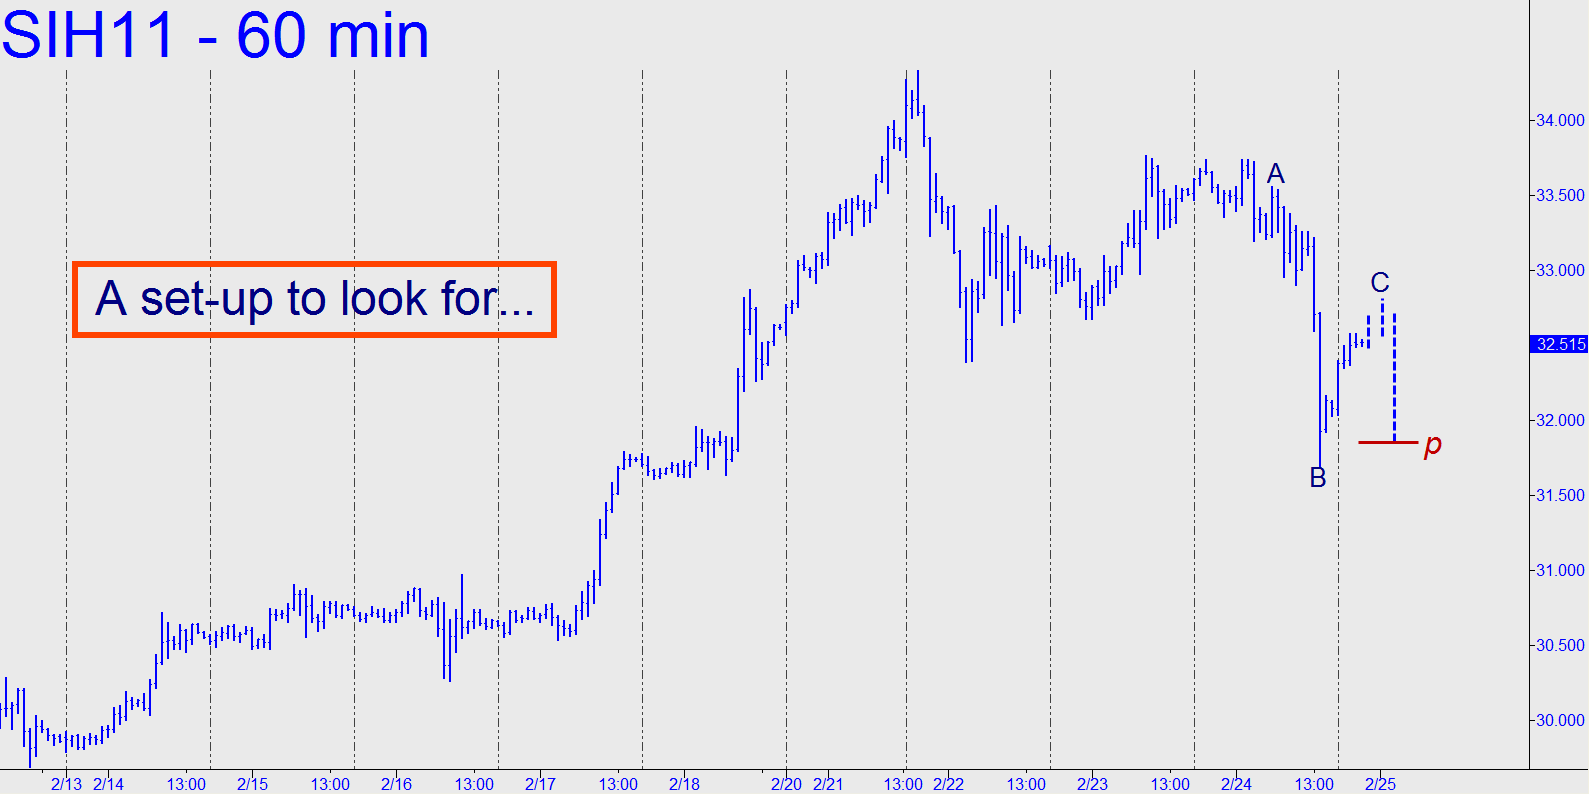
 The hourly chart simplifies a possible speculative buying opportunity, since any chart of lesser degree leaves us with too many point ‘A’s to choose from. If the pattern develops along the lines shown, consider bottom-fishing the midpoint support with a stop-loss no wider than four ticks. Bulls will need to push the futures to a close above 33.728 to set the stage for more strength next week. That’s the midpoint resistance of the 60m pattern A=30.265 (Feb 16), B=34.330. _______ UPDATE (10:26 a.m. EST): The pattern has played out so that there will indeed be a speclative buying opportunity if the futures fall to 32.190 (aka Point ‘P’) without having exceeded the overnight high, 33.125.
