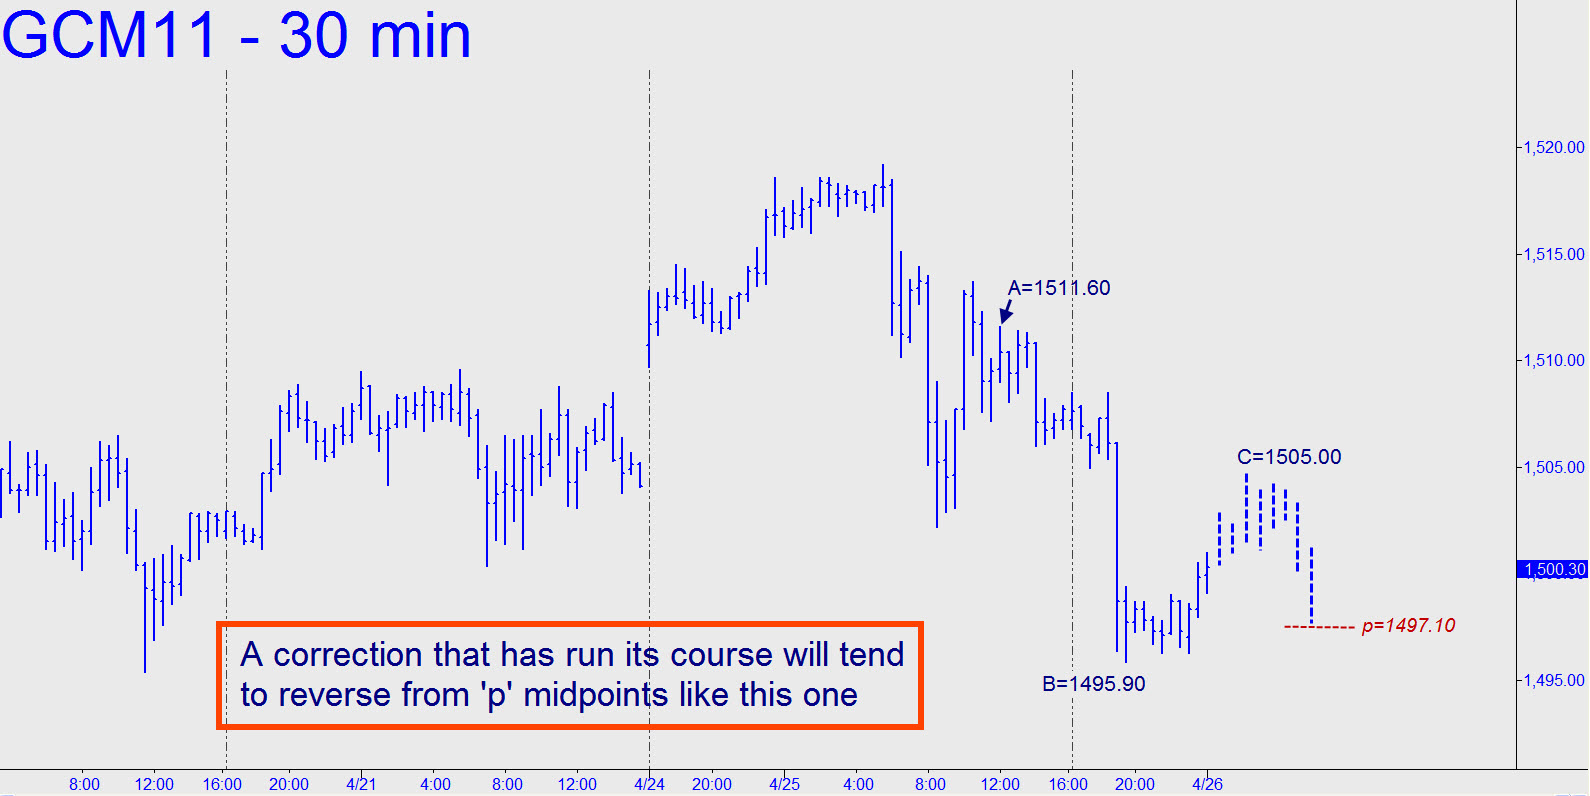
 Yesterday’s selloff in the wake of a new all-time high slightly exceeded a correction target at 1496.70, hinting of more weakness to come, perhaps only slight. To gauge sellers’ resolve, try using the pattern shown, assuming it develops more or less as depicted. A bounce from the midpoint support would be a bullish sign, but it would have to carry above two prior peaks on the lesser charts before we could infer the correction has ended. Hidden Pivot aficionados may want to take note of the gnarly one-off point ‘A’ I’ve used to compensate for the sausage-y quality of point ‘B’. Alternatively, if the futures simply continue higher Tuesday morning, a print exceeding 1514.40 would turn the lesser charts bullish once again.
