
We told subscribers to short the S&P futures yesterday, and although we’d ordinarily use a tight trailing stop because the trade flouts a 26-month uptrend, this time we intend to loosen up and let our profits run. For if the so far puny blip in the US dollar has caused commodities to plunge, and for stocks, finally, to give way, imagine what will happen if the dollar really takes off, causing a cosmic-sized carry-trade unwind as swift and lethal to many traders as investors as a cobra strike. With a big spike in the dollar, silver would assuredly be trading in the mid-$20s; copper, below $2.50; gold at $1200, T-Bond yields, well below at 4%; and the Dow, at 8000 or less. And remember: We’re not in Kansas any more. Corrections that used to take months or even years to run their course now play out in mere weeks. Nor can we rule out the possibility of a flash crash inundating the global financial system in the space of an hour or two. But even if nothing so dire seems likely, traders should nevertheless remain open to the possibility that the market crash – the Big One we’ve all known was coming ever since the Svengalis at the Fed “fixed” the banking system — has indeed begun.

Our thinking on this was stimulated yesterday by our good friend Doug B., known to long-time readers of these commentaries as The Smartest Financial Advisor We Know. He stays closely in touch with some prominent chartists and thinks some of the very best are now on the wrong side of the trade. Poring over their charts, and the ostensibly bullish triangles and wedges that can be found or imagined therein, they’ve deluded themselves and their followers into thinking there will be yet one more rally to bet on before the stock market comes crashing down. This, Doug points out, is one way in which tops are made when “everyone” expects a top – i.e., with a weakly bullish consensus that is waiting for a last-gasp rally before dashing for the exits. In the current circumstances, this is madness, Doug avers, since it would seek to squeeze the last 3% of upside potential from a market that is at risk of dropping 30% or more.
‘One Last Rally’ a Trap?
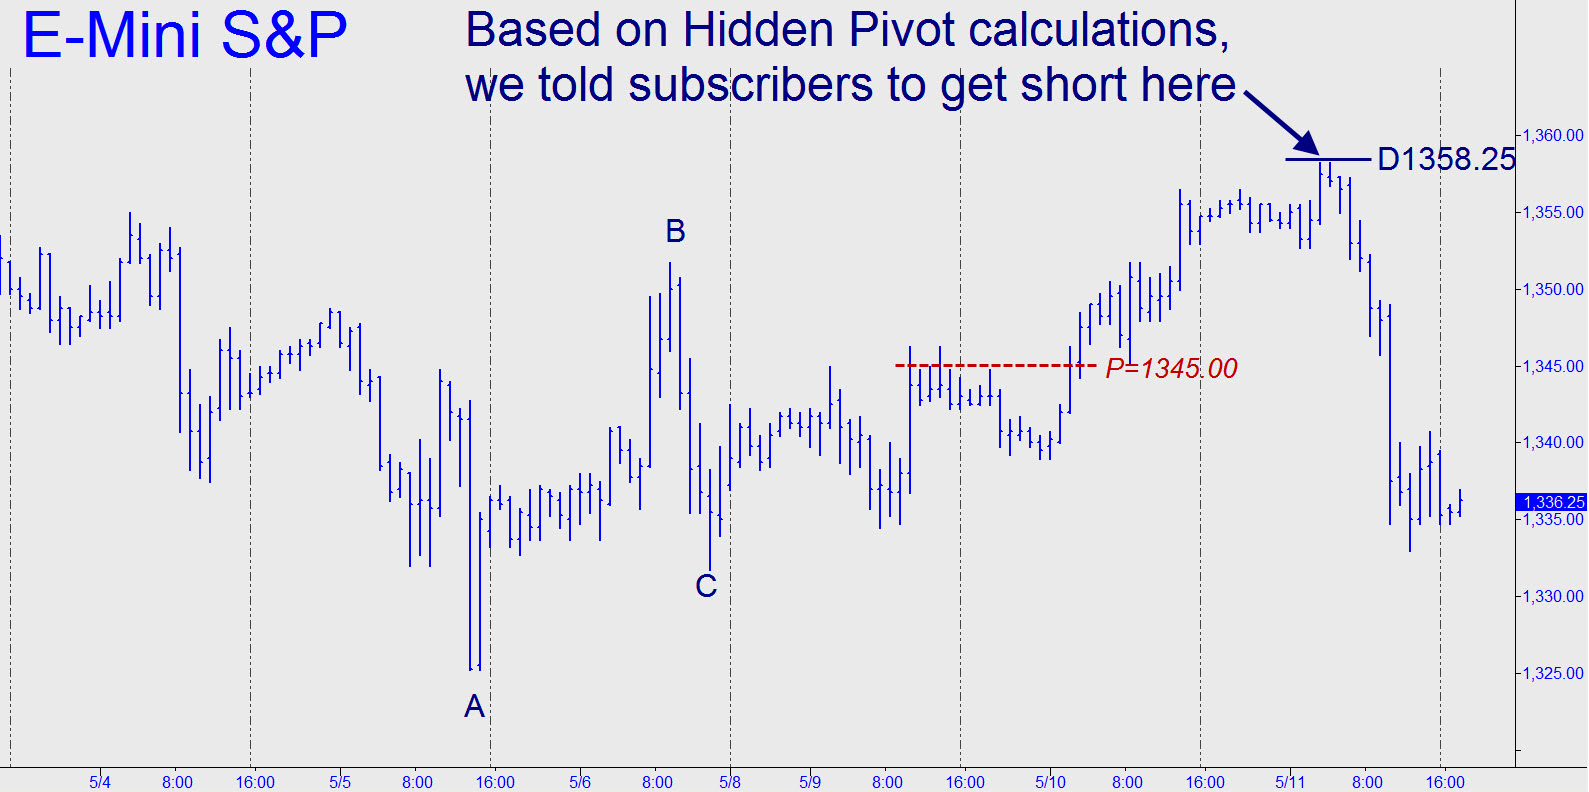
Our own technical work has called for – possibly — one last rally that would take the Dow Industrials above 13000. In practice, however, and in eager anticipation of a potentially epochal top that no market timer could be certain of nailing, we have been shorting every minor-rally target that has appeared on our radar. Applying that tactic, yesterday’s advice for the E-Mini S&P caught the intraday high precisely to-the-tick, as follows: “[We] hung out a 1358.25 target a short while ago, so let’s try shorting there with a 1.00-point stop-loss. This is probably more easily done during the night session, since morning could bring a gap-up opening, so take extra care.” A few hours later, after the futures fell to 1353.00, we told subscribers to take profits on half of the position. As of yesterday’s close, the single contract remaining was showing a paper profit of $1250. Although we do not initiate such trades with the expectation of catching the Mother of All Tops, this time around, odds of hitting a grand slam homer appear sufficient to justify letting the position run for a while without a stop-loss.
Incidentally, the proprietary techniques that we use to forecast swing highs and lows are taught at a monthly webinar from which hundreds of Rick’s Picks readers and subscribers have graduated. If you’re interested in taking the course, which will next be given on May 25-26, or if you’d like a detailed description of the Hidden Pivot Method, click here. Want to find out what graduates think of the course? You can ask them yourself by taking a free trial subscription to Rick’s Picks. You’ll have access not only to a 24/7 chat room that draws top traders from around the world, but also to trading recommendations for gold, silver, index future, stocks and options.
(If you’d like to have Rick’s Picks commentary delivered free each day to your e-mail box, click here.)
I say to the bulls go for it. good luck. What ever happened to buy low and sell high? http://bigcharts.marketwatch.com/quickchart/quickchart.asp?symb=djia&insttype=&freq=2&show=&time=20