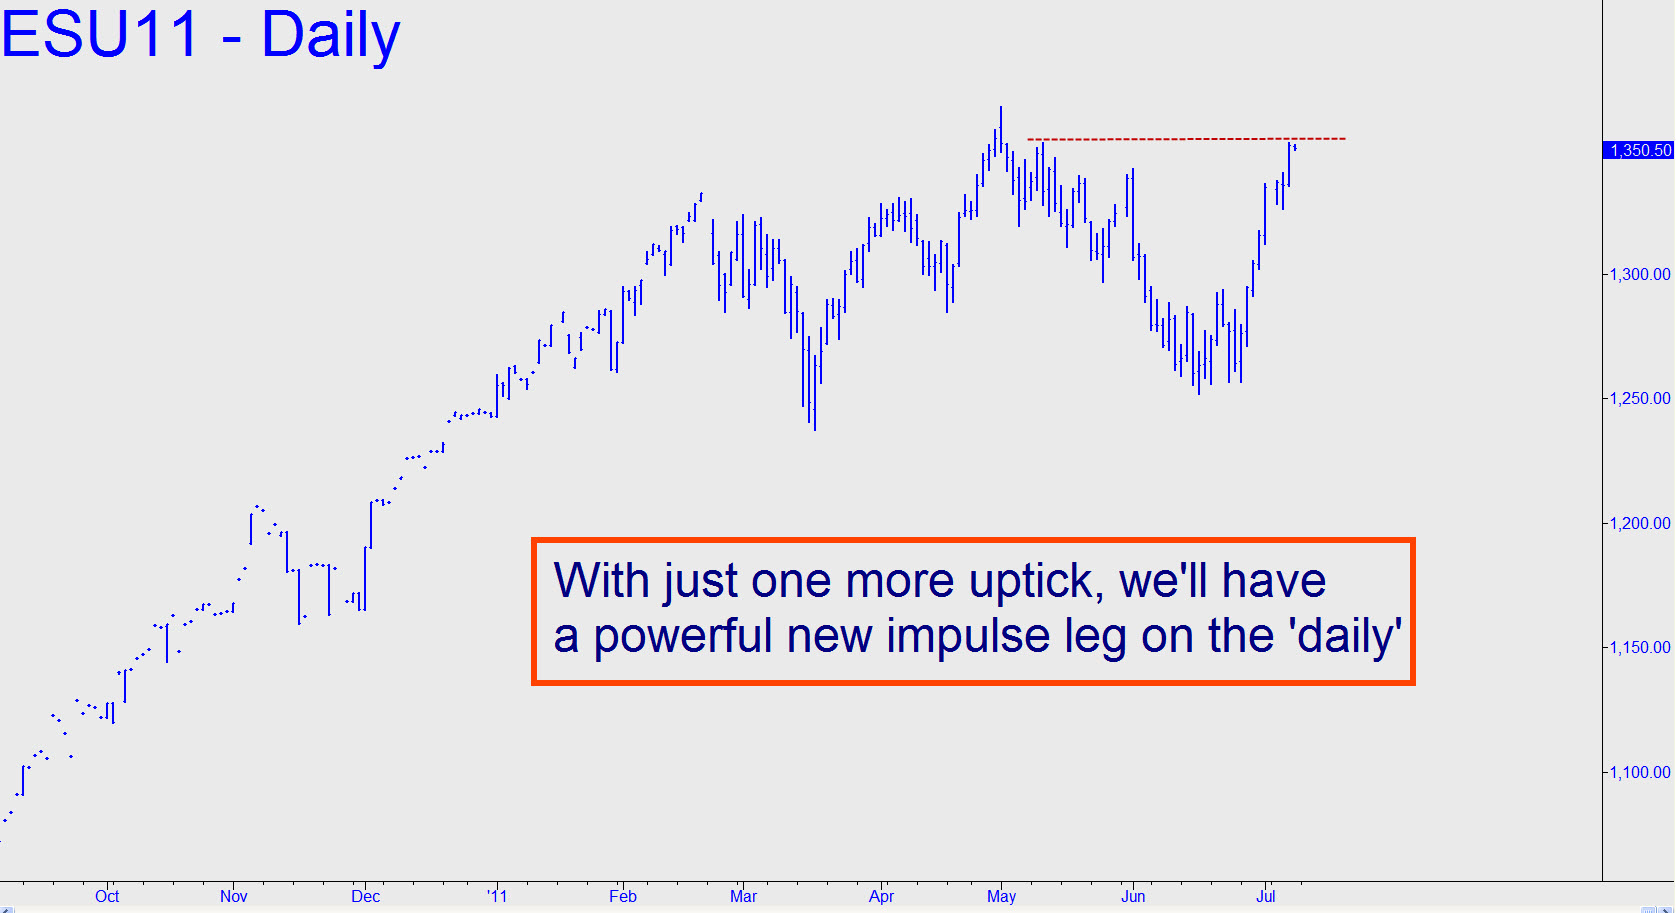
 It could have been just coincidence, but yesterday’s wilding spree stopped at 1352.75 — precisely equal to an important peak recorded in mid-May. Although that wasn’t the highest high achieved by the still-raging Mother of All Bear Rallies, its breach would probably make the actual peak at 1367.50 a sitting duck. It will only take a print at 1353.00, however, to generate a bullish impulse leg on the daily chart that will have exceeded not only the required internal and external peaks, but a second external for good measure. The 1382.25 target given here earlier remains valid whatever happens, but more immediately we should watch for fatigue near 1354.00, the Hidden Pivot target, on the hourly chart, of A=1313.25 (July 1), B=1340.75 (July 5). _______ UPDATE (11:24 a.m. EDT): Stocks are falling sharply today after topping overnight at exactly…1354.50. They are acting as though the 9.2 percent jobless rate somehow took the markets by surprise, but this idea is too stupid to credit. More likely is that we are seeing a garden-variety shakeout. The 1382.25 target will remain valid in any case, provided its point ‘C’ low all the way down at 1252.25 is not breached. That said, this downtrend could reach 1314.00 if the 1326.00 midpoint pivot associated with that midpoint gets taken out. Camouflageurs are encouraged to look for a tradable turn from either number.
