
 The unmitigated viciousness of gold’s recent price action should have made its impression by now on all who trade it. As I tried to emphasized in yesterday’s commentary, the evasive maneuvers are becoming increasingly tricky because there are evidently a growing number of bulls who have grown all too certain that quotes can only move higher over time. Gold’s job is to make sure these folks don’t get the idea that one need only buy gold at any price, and at any time, to get rich the easy way. For our part, we’ll want to pay closer attention than ever to impulse legs on charts of lesser degree — and to buy the stuff, and hedge it, whenever Hidden Pivot Analysis supports our goals. Keep in mind that we will never have to be nervous bulls if we can put aside our emotional attachment to bullion and simply heed what impulse legs in various time frames are telling us. It never has to be more difficult or complicated than that.
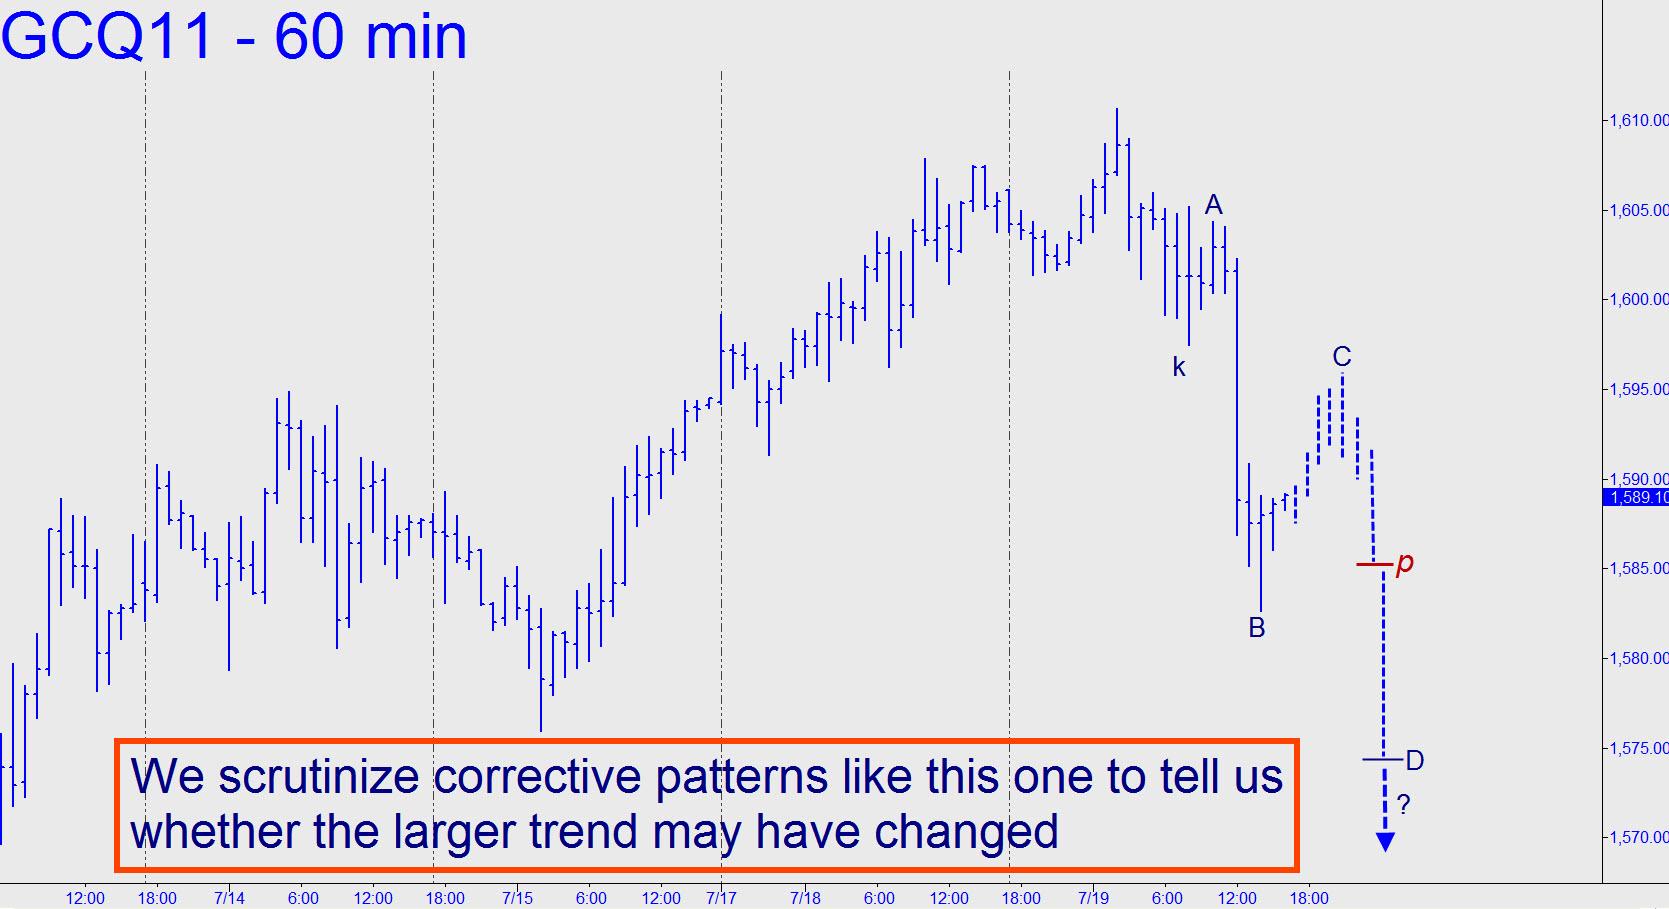
Most immediately, we should take note that the selloff begun (at 4 a.m. EDT!) from yesterday’s head-fake top is impulsively bearish on the hourly chart (though not on the ‘240,’ which would require a fall to at least 1575.90). Moreover, the decline has occurred without the August contract having achieved a 1626.30 target that goes back to A=1415.50, April 1, on the daily chart. This is a yellow flag, and it can be retracted — or perhaps replaced with a red flag — only after the futures have resolved the corrective pattern shown (or something like it; it’s hypothetical). This could happen in at least several ways: 1) ideally, via a reversal from the c-d midpoint; 2) less bullishly, via a reversal from ‘d’; or, 3) bearishly, via an overshoot of ‘d’. Alternatively, and as of this moment, an early sign of a bullish turnaround would come at 1592.30, one tick above a small, seemingly insignificant peak that can be found on the 5-minute chart at 1:54 p.m. yesterday. _______ UPDATE (10:06 a.m. EDT): Overnight action has created a corrective abcd whose 1582.30 midpoint has been exceeded so far by 1.20. The overshoot is probably sufficient for us to presume that further weakness impends to at least 1571.50, the midpoint’s ‘d’ sibling target. Alternatively, it would take nothing less than a rally exceeding 1596.90 today or tomorrow to turn the very lesser charts bullish again.