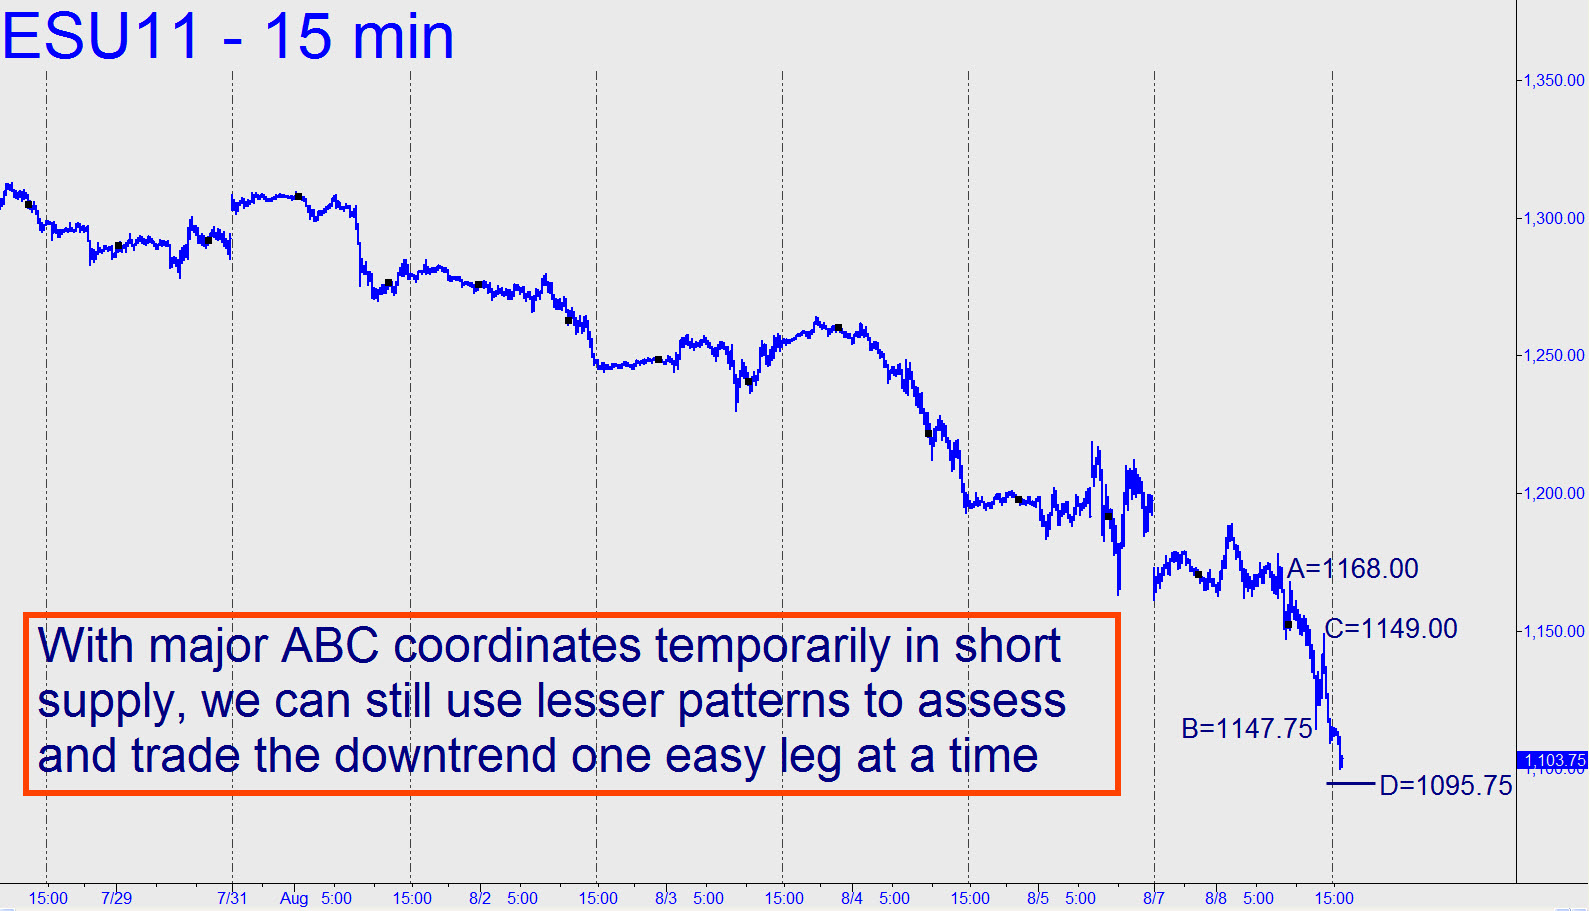
 Since there are no big patterns sufficiently compelling to measure and predict this selloff, I’ll suggest using the lesser charts and taking the down-legs one at a time. Most immediately, that would imply just a bit more short-term weakness, to at least 1095.75, in after-hours trading. That number can be bottom-fished with a stop-loss as tight as 1094.75, but you may be able to reduce the risk even further by using camouflage to get aboard on the first abc rally pattern from very near the target. As always, an easy breach of the support would imply there is weakness, possibly considerable, remaining to be spent. ______ UPDATE (2:29 a.m. EDT): DaBoyz are taking no prisoners tonight! They hauled the futures down the equivalent of 300 Dow points on thin volume after the close, then goosed them into positive territory just moments ago for the first time tonight. Let’s puts Hidden Pivots aside for the moment and focus on two short-squeeze targets that would represent a 50% retracement of the collapse from the July 22 high, and a 61.8% retracement. The targets lie at, respectively, 1212.50 and 1244.50.
