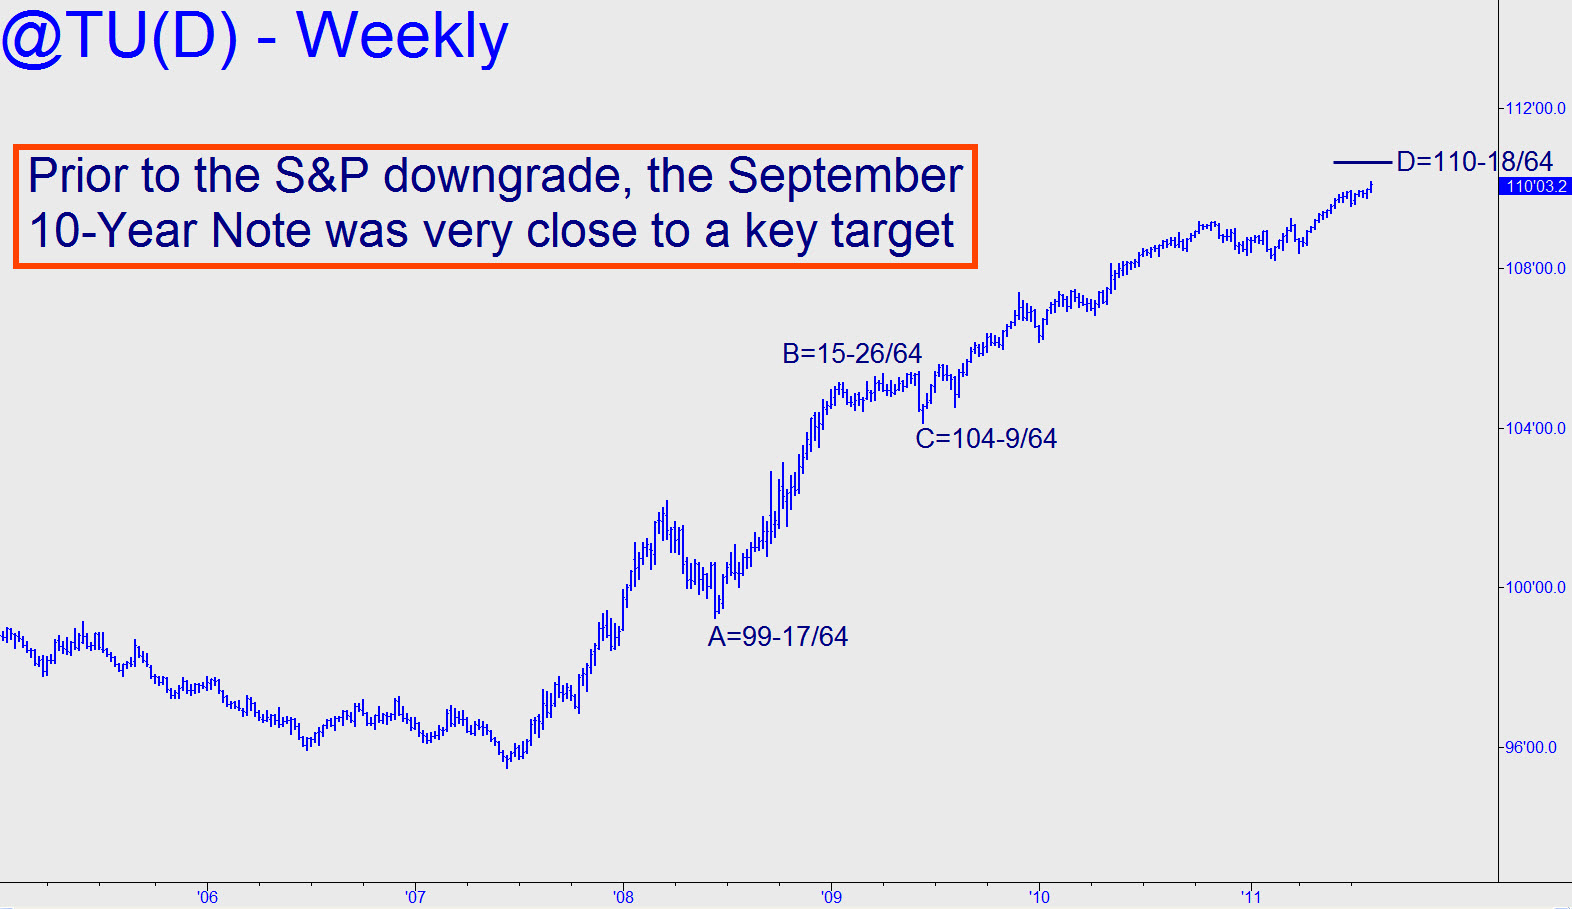
 With an S&P downgrade of U.S. debt in the pipeline, I revisited the Two-Year T-Note chart to see what alternatives might exist to the huge rally that until Friday had seemed possible based on Hidden Pivot analysis of the 30-Year. Two things are striking: 1) Although I’d projected as high as 143^11 for the September T-Bond if a Hidden Pivot at 135^13 was surpassed, the futures’ ballistic rally stopped 1/4-point shy of that threshold on Friday; also, 2) futures for the continuous Two-Year Note came within a hair of an equivalent target at 110^10. Taking both of these very-near misses together, it’s possible to infer that Friday’s highs may have marked blow-off tops for Treasury debt prices, and therefore very important lows in yields.
