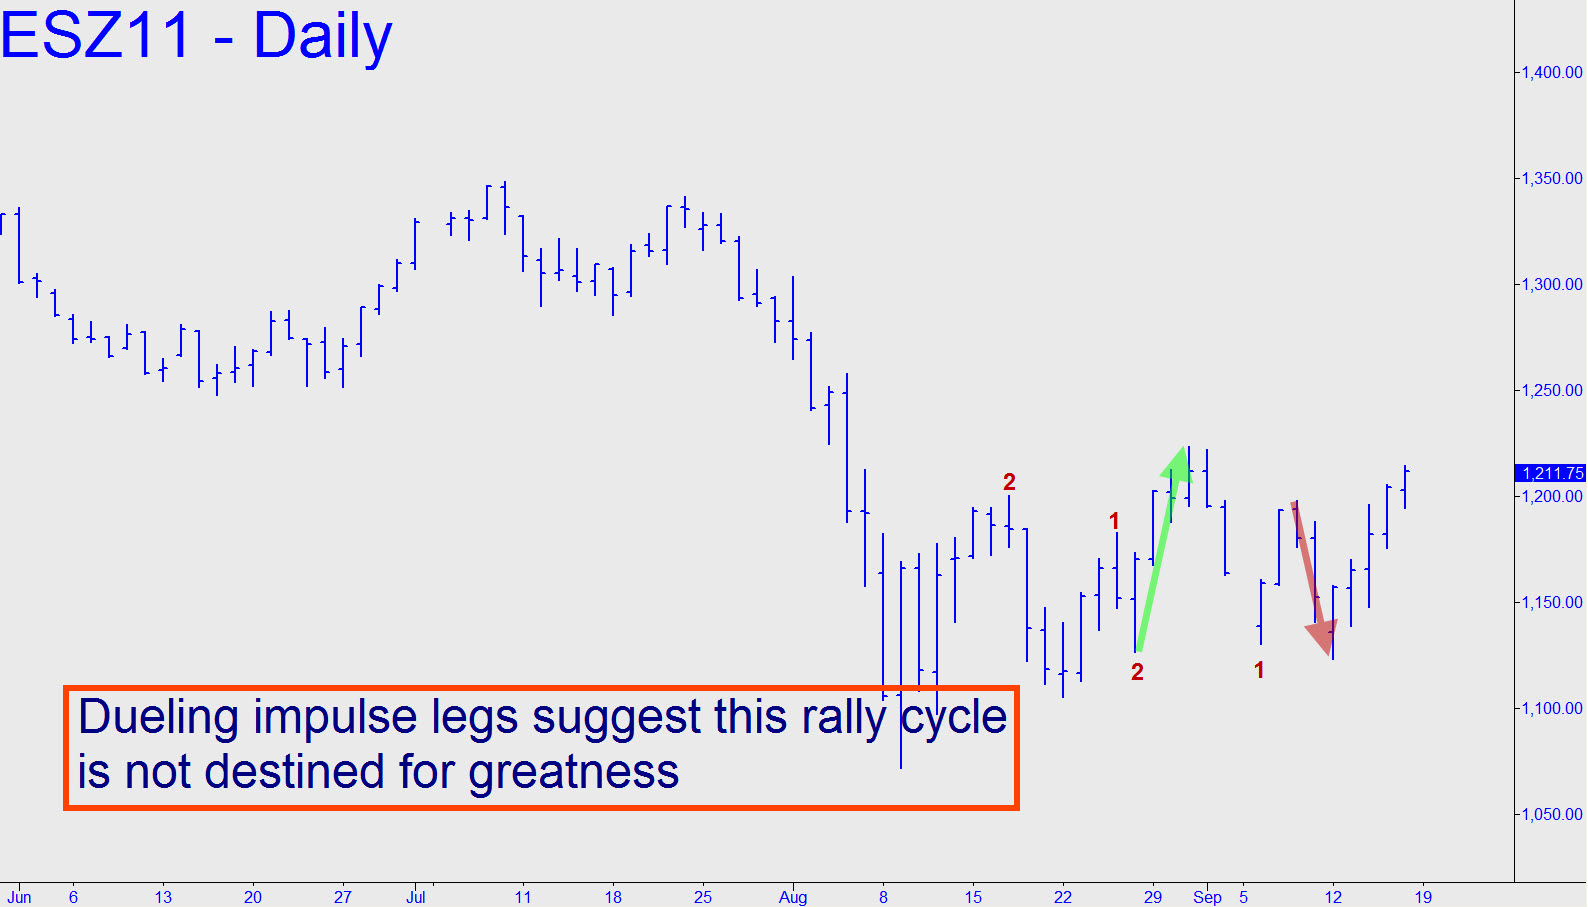
 A previously noted Hidden Pivot resistance at 1224.00 is still my minimum upside target for the near term. Please note, however, that it would come in the context of the “dueling impulse legs” shown in the accompanying, daily chart. We should infer from this ambivalent price action that the bounce begun on August 9 from 1072.00 is not destined for greatness; rather, it is most likely a bull trap — one, perforce, with enough power, persistence and…nastiness to have shaken most shorts loose by now. If they are to get serious relief and have things go their way once again, it would be signaled by a downdraft today hitting 1182.25. That would create a strong bearish impulse leg on the hourly chart by exceeding a low that marked a tradable bottom last week. _______ UPDATE (12:14 a.m. EDT): After opening down 12.50 points Sunday night, the futures have drifted lower, to 1191.25. They will need to fall a further 1.75 points to hit a Hidden Pivot midpoint at 1189.50 associated with the pattern: (5-minute chart) a=1212.75 on Friday’s closing bar; b=1194.50 on Sunday at 6:25 p.m., and c=1198.50. If the support is crushed, however, the next place where buyers might find traction lies at 1180.50, its ‘d’ sibling. Either of those numbers can be bottom-fished with a stop-loss as tight as you can abide, but if the first is exceeded by more than a point or so, the second would become an odds-on bet. _______ UPDATE (11:54 a.m. EDT): Last night’s kamikaze dive stopped at 1181.50, a single point from my Hidden Pivot “deck”. Most interestingly, even on the one-minute chart, at least two potential camouflage trades turned into bull traps by stopping out their respective point ‘C’s.
