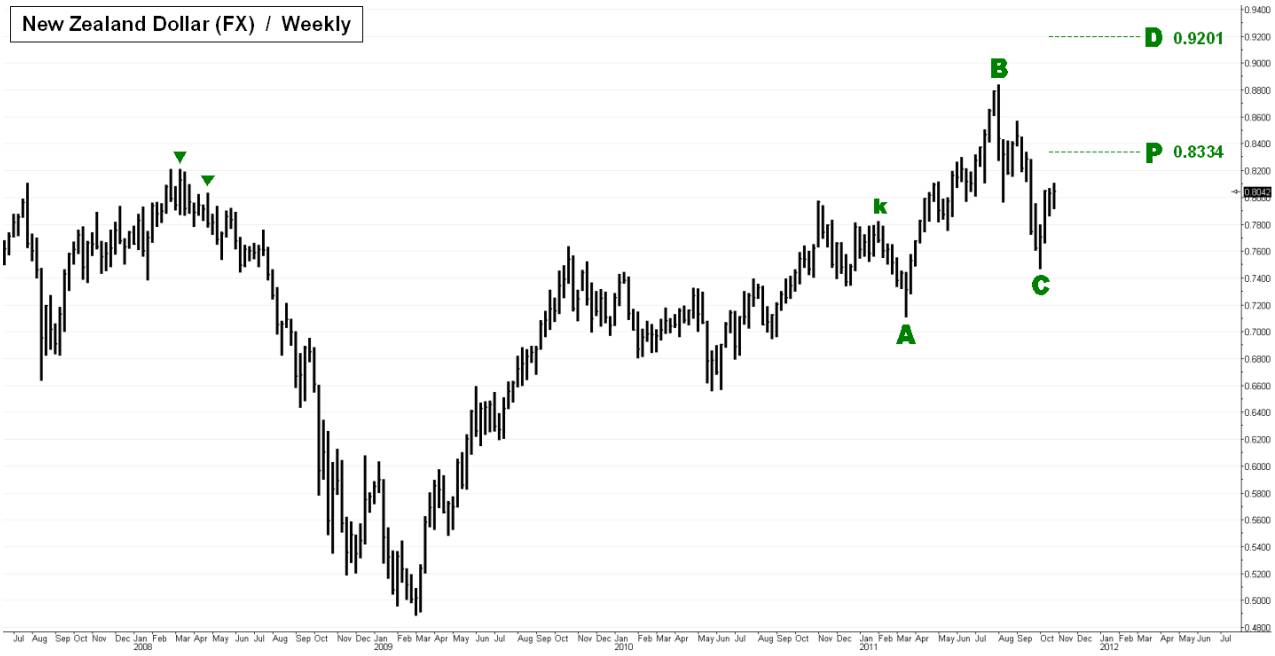
 A big shout-out to subscribers down under as we cover the Aussie and New Zealand dollars in today’s edition. The mid-2011 highs in the Australian dollar completed a multi-year pattern whose BC leg was the selloff of 2008. After the July 2011 high, the Aussie fell by as much as 15% and then recovered substantially. Within the CD leg of the multi-year pattern are several versions of a new impulse leg that peaked in July. The October 4 low looks a lot like a “C” point, which would mean that higher prices are coming. If the Aussie needs to consolidate a while longer, we might expect a short-term peak to come at 1.0894. This is the midpoint of an active pattern on the weekly spot market chart, with the “A” point in May of 2010. Futures traders should keep one eye on the spot market and look for a camouflaged opportunity to short if and when the spot price gets close to the pivot. The New Zealand dollar has not reached its multi-year “D” target, which we reckon to be 0.9131 based on the monthly spot FX chart. A pattern on the weekly chart jumps out at us due to its three sharp coordinates, with a midpoint at 0.8334 and a “D” target at 0.9201, as pictured in the attachment. (Posted by Doug “harry” McLagan)
