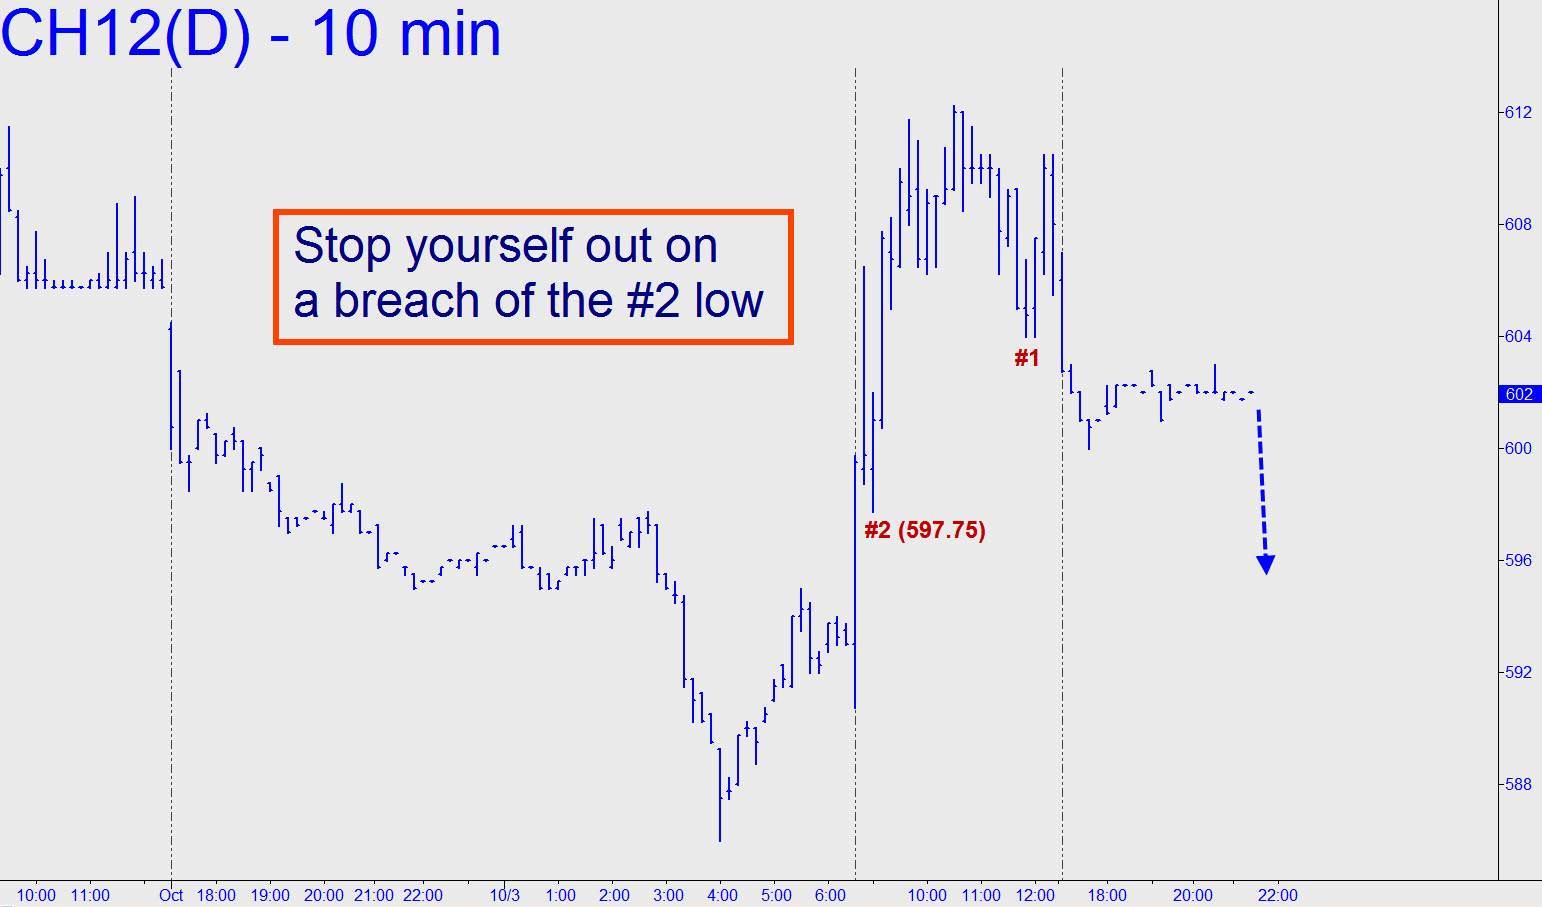
 Looking to catch the start of a potentially powerful bullish reversal, we’ve staked out a long position within three cents of yesterday’s 586 bottom. Our cost basis is 587, with 25% of the original, theoretical position remaining. I’d suggested stopping yourself out if the futures create a bearish impulse leg on the 10-minute chart. As of around midnight Monday night, this implied exiting on a print below 597.75. The chart shows why that number is significant, although even a small rally could render it moot. ______ UPDATE (October 5): We exited on a stop at 595.50 for a paper profit of around $400 per contract. The stop may prove to have been a tad too conservative, but conservatively is the way I trade. ______ FURTHER UPDATE (October 5): In retrospect, with the futures up sharply off Tuesday’s lows, I can say that it was not conservative play, but just plain stupidity, that got us stopped out of the trade. Because we are trying for a very safe entry in order to catch a potentially BIG move in corn, I should not have nickle-and-dimed the stop so as to eliminate the possibility of even a small loss. In fact, we had found a great entry spot and subsequently took enough partial profits to allow for a pullback all the way back to Tuesday’s low without sustaining a loss. My stop-loss should have been just beneath that low, which would have subjected us to a whopping theoretical risk of less than $100.
