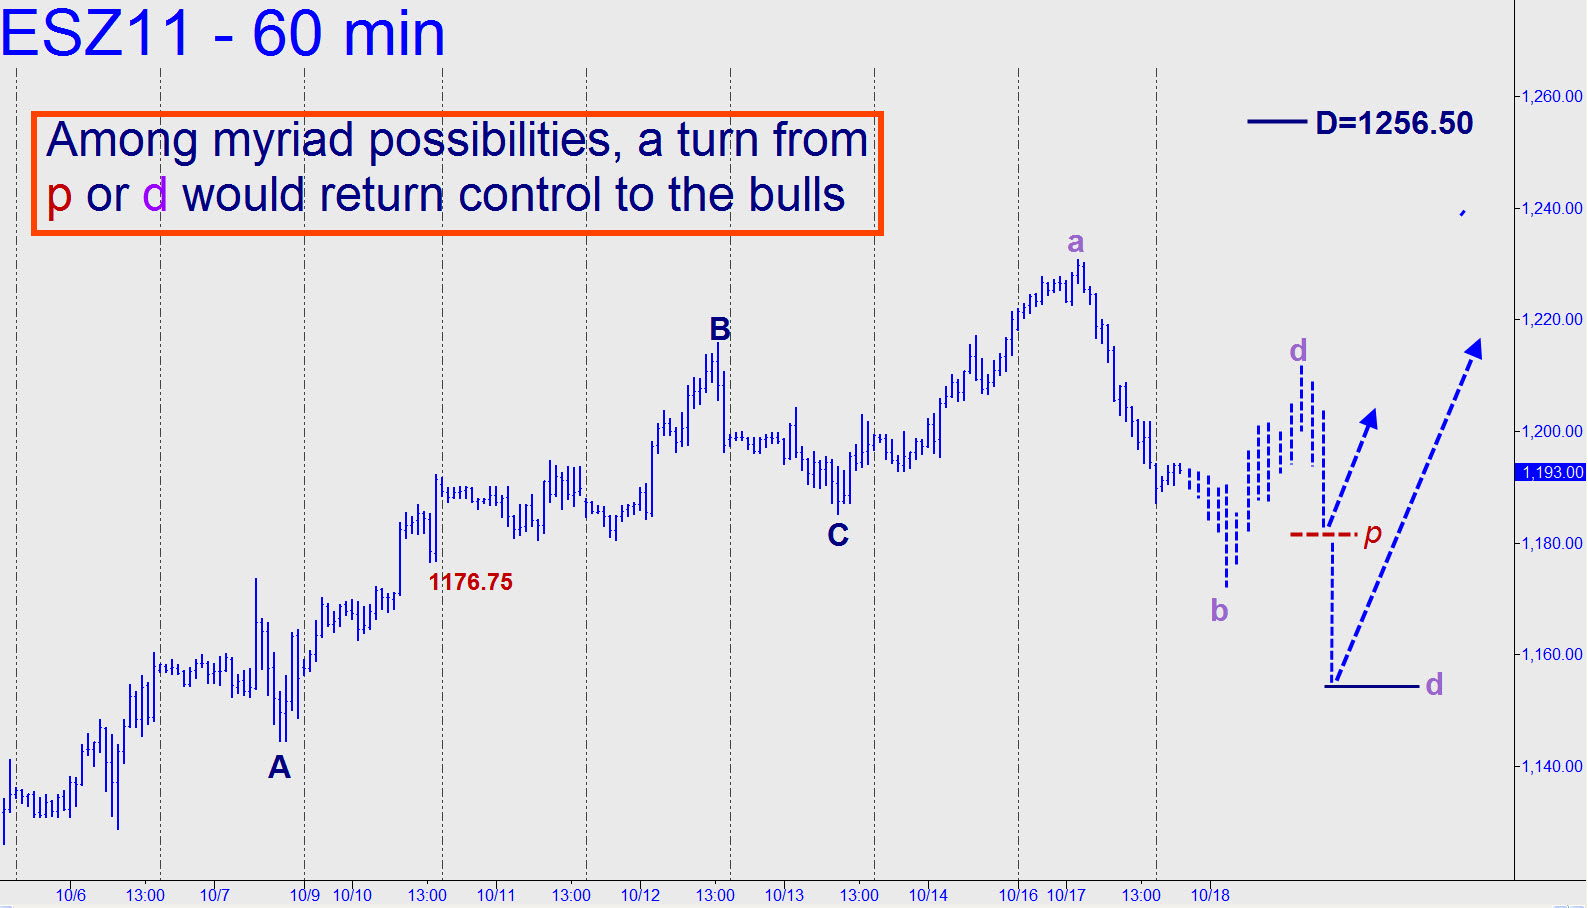
 I didn’t fall in love with the bullish pattern in yesterday’s chart for no good reason, since it has always worked. Not this time, though, and although it would be no stretch for me to infer that the market has caught a whiff of something scary out there, I’m going to let my instincts be guided entirely by the simple action of impulse legs on the hourly chart. This is notwithstanding my gut feeling that They cannot pull the plug as long as the Merkel-Sarkozy supposed plan awaits explanation and headline treatment. Concerning impulse legs, yesterday’s plunge did not actually alter the 1256.50 target, since its 1185.25 point ‘C’ was not breached. It likely will be today, though, and if so, we can use the 1176.75 low from October 10 as a tripwire to warn of a pick-up in the tempo of the selling. Whatever happens, it is the c-d down-leg that follows this presumptive impulse leg that will perforce yield the most useful infomation. If the rally has a second thrust in it, we should see that follow-through reverse from no lower than its ‘d’ target. More bullish still would be a reversal from its ‘p’ or above. I’ve sketched this hypothetically so you can see it in pictorial form.
